Table of Contents
In stock and forex trading, a tick is used to measure the fluctuation in the price of a security. It is a unit of measurement used to determine how much the price has changed between two trades. A tick is equal to one cent when trading stocks priced above $1 and can range from fractions of a penny to multiple dollars depending on the stock’s price.
What is a tick in trading?
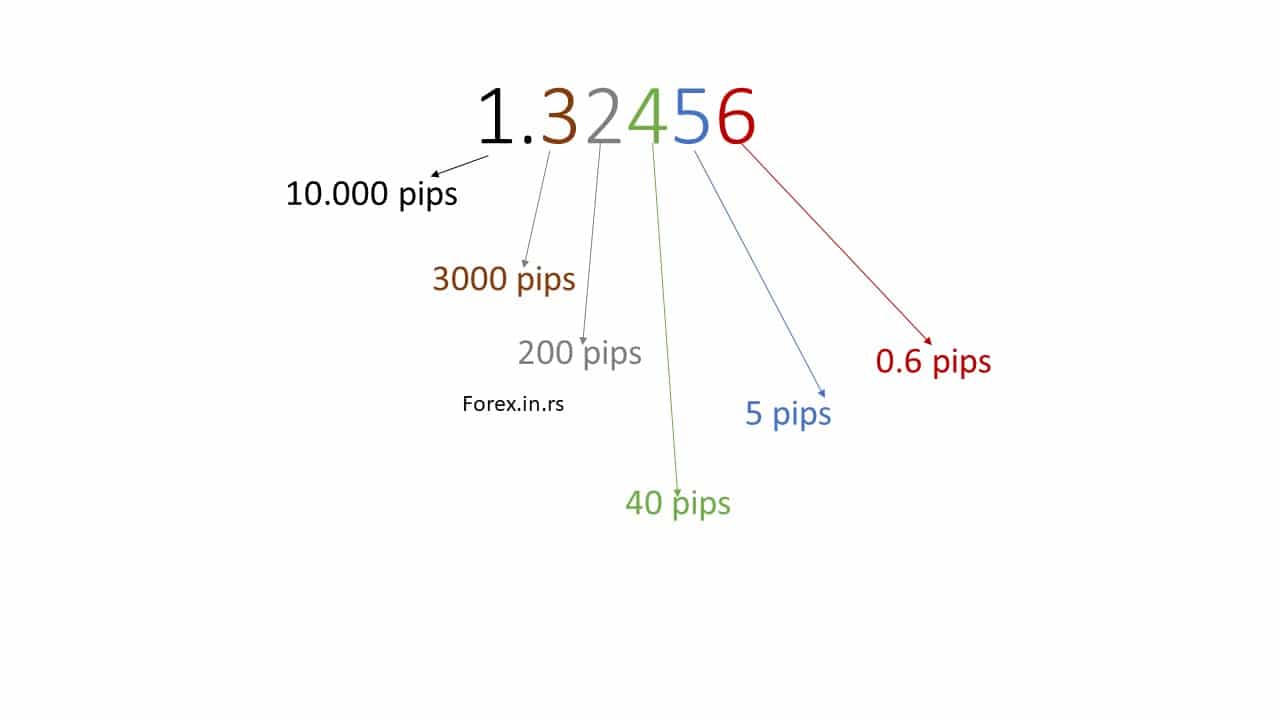
A tick represents the difference between the current market price and the last-quoted market price that fluctuates in real-time, such as a price change from 1.30612 to 1.30613. Usually, the tick term is a measure of the movement in the price of a security. However, the tick has another meaning in stock trading as a transaction between a buyer and a seller at a given price and volume and presents the change in the price of a security from one trade to the next trade. The minimum tick size for stocks trading above $1 is one cent.


Below on image, we can see five pips (blue color) and six ticks (red color):


A tick can also refer to a buyer and seller transaction at a given price and volume. This transaction will represent the change in the price of that security from one trade to another. This allows investors to track their investments and see how they are performing and make decisions about when to buy or sell based on changes in prices over time.
Ticks are essential for investors who want to maximize profits by taking advantage of small price movements over short periods. For example, if an investor sees an imminent increase in the price of a stock, they may buy more shares before it goes up to reap more significant returns than if they had waited until after the increase happened. On the other hand, investors who are bearish on a particular stock may choose to sell before an expected decrease and not lose too much money during this downturn.

Ticks also provide investors with additional insight into how markets behave as they reflect supply and demand changes over time as different traders enter and exit positions. By monitoring ticks closely, investors can spot anomalies or trends that could signal potential profit opportunities or risks associated with any particular investment.
The size of each tick differs according to different exchanges and markets, as well as specific stocks being traded at any given moment. Generally speaking, larger-cap stocks tend to have more giant ticks since there tends to be more liquidity around these securities than mid- or small-cap ones; however, this can vary depending on market conditions and investor activity at any given moment.
Overall, understanding what ticks are and how they work is critical for anyone looking to invest in stocks or other financial instruments such as futures contracts or options. With enough knowledge about ticks, investors can make informed decisions about when (and how) much capital they should allocate towards any particular asset class depending on market conditions then; making sure not just that they get maximum returns but also minimizing risk levels along the way through good decision-making processes informed by accurate data sets regarding market movements over time.
What is a tick chart in trading?
Unlike time-based charts, a Tick Chart measures transactions and draws a new bar after a set number of trades. For example, a 250-tick chart outlines a bar for every 250 trades, regardless of how long it takes to accrue those 250 trades.
Day traders trading in forex, shares, or futures refers to charts to get market-related information quickly so they can decide soon. These charts provide prices and trading activity information using different criteria like time, volume, price range, or ticks. Many people unfamiliar with forex or another trading will ask what tick data is in forex. The tick-based charts show the changes in the currencies’ process after a specific number of trades or transactions called ticks are completed. A new chart is drawn after a particular period for time-based charts; the tick charts will be drawn after a specific number of trades or ticks are completed. For example, if the chart illustrates a bar graph after 40 transactions are completed, it will be called the 40-tick chart.
What is tick data in forex?
Tick data represents databases of each tick transaction for assets such as forex, stocks, etc. Using tick data, traders can build models for better day trading strategies and short time frame setups. However, Forex tick chart trading is extremely short time trading, and systems have colossal noise and many losing trades in a row.
For example, traders can use tick data to identify recurring patterns associated with news releases or macroeconomic events. This helps them anticipate future market movements more accurately and make more informed trading decisions. When it comes to Forex trading specifically, tick data can be used to identify short-term strategies such as scalping and day trading. Scalping involves making numerous small profits throughout the day by taking advantage of sudden price fluctuations in the market.
Day trading involves holding positions for one day or less before closing them out with a profit or loss. Both strategies require up-to-date information on prices and trades to be successful, and tick data is ideal for this purpose. Using tick data requires access to sophisticated software platforms and powerful analytical tools, which are often too expensive for individual traders who don’t have enough capital or experience yet. However, specialized brokers now provide access to high-quality tick data feeds for a reasonable cost, allowing even novice traders to use this valuable resource when analyzing the markets and formulating their strategies accordingly.
Tick data has become an essential tool for successful Forex trading because it provides more accurate analysis than traditional charts and draws attention to emerging trends that would otherwise go unnoticed by other methods of analysis. By leveraging cutting-edge technology like tick datasets provided by specialist brokers, even individual traders without large amounts of capital can enjoy all the benefits this powerful tool has offered in terms of improved risk management and better decision-making regarding Forex trading.
Forex tick chart trading is extremely short time trading, and systems have colossal noise and many losing trades in a row.
Fx tick data are part of the MetaTrader program and valuable for Expert advisors and indicators.
Tick charts Benefits
Since traders analyze the market before deciding, the tick charts can help get better insights and additional valuable data when used alone or with conventional time-based intraday charts. One of the valuable inputs provided is the relation between trade volumes and prices. Since the ticks charts will be generated based on the number of trades, the charts depend mainly on market activities, and they are rendered more often when there are more trades.
This makes it easier for the trader to notice the volatility and momentum in the market. Time-based charts will show a few bars during low activity periods, like after hours or noon, while the tick charts will be generated less often. However, the tick charts will still be helpful for spotting trends, resistance, and support levels while trading. When the markets are volatile, the price fluctuation is indicated in a long candle in time-based charts. In contrast, the tick charts are more detailed since they provide information about direction, momentum, and any reversal. This information may be helpful for traders who prefer forex scalping. More symmetry is also noticed for tick charts.
Tick charts Disadvantages
Forex traders should know that only some charting packages and brokers provide tick data. Also, if the trader compares the tick charts, he will often notice differences. Though the tick data is related to the number of completed trades, some of the reasons for the differences are data feeds, aggregation of transactions, differences in the calculation, or missing data.
Choosing the number of ticks for the chart
Traders can choose from any ticks depending on their personal trading preferences. Charts with ticks corresponding to Fibonacci numbers 13 and 21,34 are popular with some, while others choose 233, 133, or 33 ticks. Others may choose the number of ticks for their chart depending on their trading duration, like five minutes. This allows the user to notice the changes in market volume during slow or peak activity and make decisions accordingly. Some experimentation may be required to determine the correct tick chart for a trader.
Trading using tick charts
Forex traders have developed various types of trading strategies that are based on tick charts. Day traders may use 2000-tick charts, while those who prefer price scalping will use 70-tick charts for making quick decisions. Each trader must determine which kind of tick chart is most suitable based on his strategy.

He is an expert in financial niche, long-term trading, and weekly technical levels.
The primary field of Igor's research is the application of machine learning in algorithmic trading.
Education: Computer Engineering and Ph.D. in machine learning.
Igor regularly publishes trading-related videos on the Fxigor Youtube channel.
To contact Igor write on:
igor@forex.in.rs
Related posts:
- How to Download History on MT5? – MetaTrader 5 Tick Data Export
- 1-minute Scalping Trading Strategy Example Using EMA20
- How to Read Forex Bar Charts?
- Renko Charts Disadvantages
- What is Point Value in Trading?
- Historical Time and Sales Data in Forex Trading
- Are Renko Charts Profitable?
- How to Use Level 2 Market Data? – Market Data Levels
- How to Read Forex Charts?
- The Best Stock Ticker – Live Market Charts Free
- How Do Renko Charts Work? – Download Free Renko Chart Indicator
- What is Time Frame in Forex? – Forex Time Frames Explained
