1-Minute scalping strategies are fast-paced trading techniques that target small price movements within very short timeframes. These strategies often involve executing many trades in a single session, aiming for quick profits. However, I personally believe that scalping can be dangerous, primarily due to the substantial commissions one might incur from such a high frequency of trading. The cumulative effect of these commissions can quickly erode profits and even lead to significant losses.
Trading one-minute charts represent a short-time strategy where traders trade in an elegant style where a new bar forms every minute, showing the high, low, open, and close for that one minute. Scalper traders usually use a one-minute chart time frame. For better profitability, one-minute chart trading strategies always follow the primary trend (hourly, daily, etc. ).
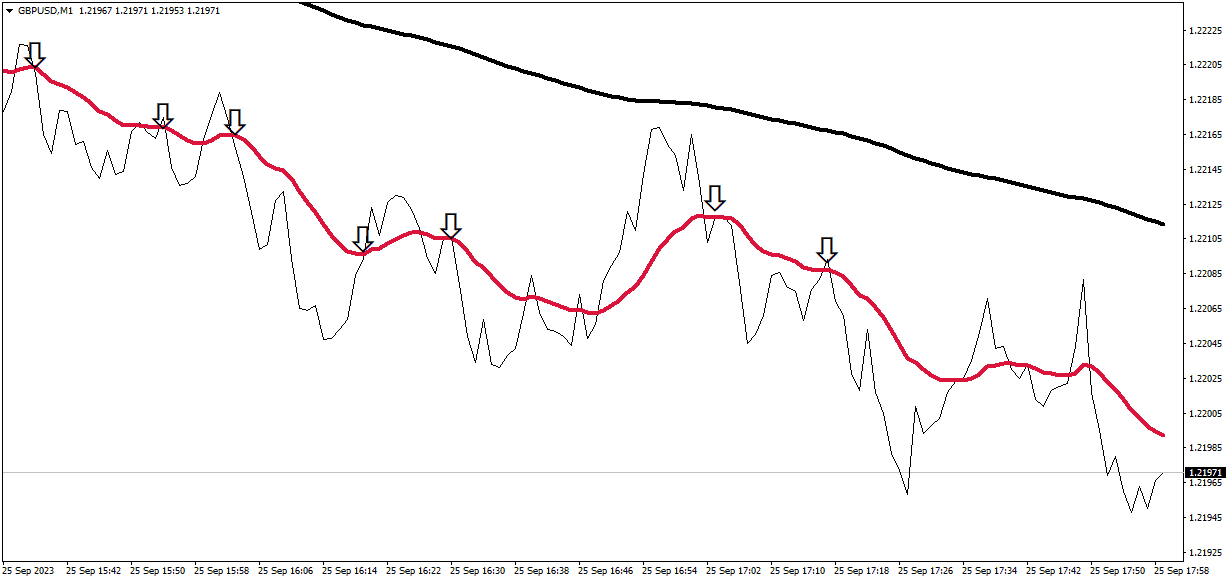
1 minute Chart Trading Strategy Example
For a buy scenario in the 1-minute trading strategy, ensure the price is above the daily chart’s EMA200, which is flat or horizontal, and concurrently, the price should be near the MA20 on the 1-minute chart, which is trending upwards. Conversely, for a sell scenario, the price should be below the flat or horizontal EMA200 on the daily chart and simultaneously approach the MA20 on the 1-minute chart trending downwards.


Please see my video about this trading strategy:
The 1-minute chart strategy involves utilizing short-term price movements for potential trading opportunities by studying price action in a 1-minute timeframe. Let’s delve into the two examples provided:
One Minute Chart Scalping Trading Strategy – Example
Criteria:
- Use a 200-period Exponential Moving Average (EMA200) on the daily chart to gauge longer-term trend direction.
- Use a 20-period Moving Average (MA20) on the 1-minute chart to gauge short-term price action.
Buy Conditions:

- The price is above the EMA200 on the daily chart.
- EMA200 is flat or horizontal (indicating no strong trend).
- The price is near the MA20 on the 1-minute chart.
- MA20 on the 1-minute chart is trending upwards.
Sell Conditions:
- The price is below the EMA200 on the daily chart.
- EMA200 is flat or horizontal.
- The price is near the MA20 on the 1-minute chart.
- MA20 on the 1-minute chart is trending downwards.
Situational Analysis:
- In the first situation, the opening market time sees many trades, creating multiple price swings. If a trader relies solely on a 1-minute chart, there’s a delay, potentially missing optimal trade entries.
- In the second situation, during lunchtime, trades may reduce. With a specific tick chart (e.g., 90-tick chart), no new bar may form until 90 trades occur. But with a 1-minute chart, you’ll get a new bar every minute, regardless of the number of trades.
Let us analyze the whole strategy:
This 1-minute trading strategy aims to align long-term and short-term momentum in the same direction to minimize drawdowns and increase the probability of successful trades. The strategy utilizes two primary moving averages: the EMA200 for determining the market’s overall direction and the MA20 for pinpointing optimal entry and exit points aligned with this overarching direction.
Understanding the Indicators:
- EMA200 on the Daily Chart: The 200-period Exponential Moving Average barometer is the longer-term market trend. A flat or horizontal EMA200 indicates a lack of a strong trend, suggesting the market may be in a range or consolidation phase. This lack of a solid trend is critical to the strategy as it suggests there won’t be opposing solid forces when you attempt to trade off the 1-minute chart.
- MA20 on the 1-minute Chart: The 20-period Moving Average on the 1-minute chart gives us a glimpse into the recent price momentum. An upward-trending MA20 indicates bullish short-term momentum, while a downward-trending MA20 signals bearish momentum.
Executing the Strategy:
- Going Long (Buying):
- First, look at the daily chart. Ensure that the price is currently above the EMA200 and that the EMA200 is either flat or horizontal, implying that there isn’t a solid downward trend.
- Switch to the 1-minute chart. Here, you want the price to be near the MA20 and, crucially, for the MA20 to trend upwards. This ensures that you’re buying into positive short-term momentum, aligning with the broader bullish bias from the daily chart.
- Going Short (Selling):
- On the daily chart, the price should be below the EMA200, and similar to the buying conditions, the EMA200 should be flat or horizontal, ensuring no solid upward trend in place.
- On the 1-minute chart, ensure the price is near the MA20 and that this MA20 is trending downwards. This ensures that the short-term bearish momentum aligns with the broader bearish perspective from the daily chart.
Conclusion
The strategy’s success lies in its dual validation approach, seeking alignment in momentum across two timeframes. This can limit drawdowns as you ensure immediate and broader market forces are moving in your favor. However, as with all trading strategies, it’s essential to use stop losses and risk management techniques to protect your capital. Always test any strategy in a demo environment before applying it to live trades.

He is an expert in financial niche, long-term trading, and weekly technical levels.
The primary field of Igor's research is the application of machine learning in algorithmic trading.
Education: Computer Engineering and Ph.D. in machine learning.
Igor regularly publishes trading-related videos on the Fxigor Youtube channel.
To contact Igor write on:
igor@forex.in.rs
