Table of Contents
We can analyze the trading time frame from a chart point of view and a general point of view. Different time frames provide different perspectives on the market. Therefore, traders often analyze multiple time frames to comprehensively understand price action, trends, and market dynamics.
For example, they may use a higher time frame, like the daily chart, to identify the overall trend and then switch to a lower time frame, like the 15-minute chart, to fine-tune entry and exit points.


What is Time Frame in Forex?
The time frame in forex trading represents the duration or interval of a specific chart that displays price data. Based on the time frame strategy, trading can be long-term, medium-term, and short-term. For example, chart time frames in the MT4 trading platform can be M1, M15, M30, 4H, Daily, Weekly, and Monthly.


Time frames indicate the period over which price movements and fluctuations are depicted. Traders use different time frames to analyze and interpret market trends, make trading decisions, and determine the appropriate trade entry and exit points.
Forex charts are available in various time frames, ranging from short-term to long-term. Here are some typical time frames used in forex trading:
- Tick Charts: Tick charts represent each transaction or price change. They show the most detailed level of price movement and are commonly used by high-frequency traders or scalpers.
- 1-Minute Chart: This time frame displays price data in one-minute intervals. It provides a slightly broader view of market movements and is suitable for traders who prefer short-term trading or day trading.
- 5-Minute Chart: This time frame aggregates price data over five-minute intervals. It smooths out some short-term noise and allows traders to observe price patterns and trends within a shorter time horizon.
- 15-Minute Chart: The 15-minute chart provides a broader market view, showing price data at 15-minute intervals. It is commonly used by swing traders who hold positions for a few hours to a few days.
- 1-Hour Chart: This time frame displays price data in one-hour intervals. It suits traders who want to capture medium-term trends and hold positions for a few hours to a few days.
- 4-Hour Chart: The 4-hour chart offers a longer-term perspective, showing price data at four-hour intervals. Swing traders and position traders often use it to capture trends over several days or weeks.
- Daily Chart: The daily chart displays price data for each trading day, offering a broader view of the market. It is favored by swing and longer-term traders who hold positions for several days to weeks.
- Weekly Chart: This time frame provides a big-picture view of the market, with each bar or candlestick representing a week’s price data. Long-term traders and investors commonly use it.
The choice of time frame depends on individual trading styles, strategies, and preferences. Shorter time frames are valid for active traders seeking quick profits, while more extended periods are suitable for traders focusing on broader market trends and long-term investment perspectives. Traders must select a time frame that aligns with their trading goals and allows them to analyze price patterns effectively.
One-minute chart time frame tracks price movement in five-minute increments; hourly chart time frame tracks price movement in hourly increments, etc.

Below is an example of the M1 chart and Daily Chart:
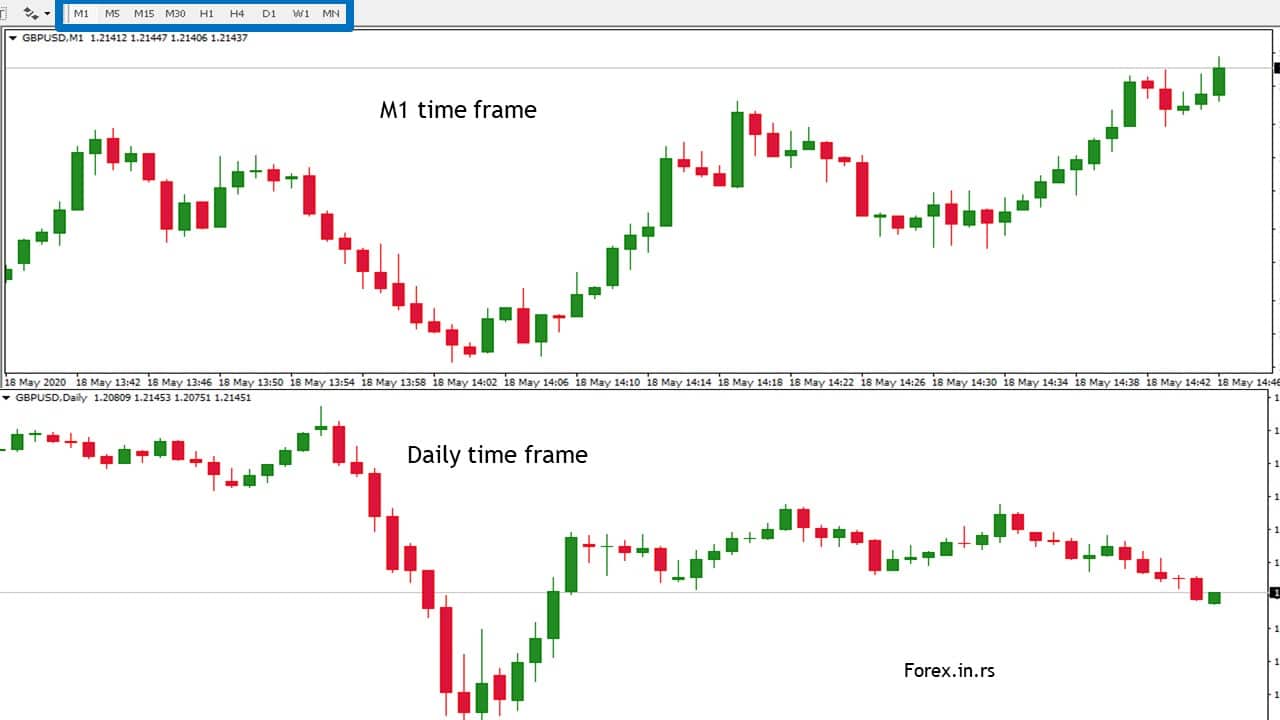
The blue rectangle on the image is the option to switch from one-time frame to another.
Using various forex time frames can most assuredly assist traders in finding more significant trends and more granular price activity. It is noted that there can be deriving diversified points of view if there are various time frames regarding the same currency pair. Doing so can be beneficial for conducting analysis, or this may also be a hindrance when conducting research. As a result, it is necessary to comprehend forex trading time frames right from working trades.
Time frames utilized in forex trading are generally categorized as short-term, medium-term, or even long-term. Traders can implement the usage of all these trading time frames. Or they can also resort to just applying one longer and one shorter one when analyzing possible trades. Though more extended time frames can be proven to help identify the setting up of a trade, it is noted that shorter time frames are beneficial when it comes to timing the entries.
The long-term time frame is for those who have a position trading style. The trend of the long-term time frame tends to be weekly. The trigger of the time frame is regarded as being daily. The medium-term time frame is for those who possess a swing trading style. The short-term time frame trend is daily, and the trigger of the medium-term time frame is a period of every four hours. The short-term time frame is for those who engage in day trading. The short-term time frame trend is every four hours, and the trigger for this short-term time frame is hourly.
What is the best trade frame?
Forex trading has no best time frame, but some trading styles usually use some time frames. There are three main time frames types:
- Position trading time frame – Daily, weekly, and monthly chart time frame.
- Swing trading time frames from 30-minute charts to the Daily chart time frame.
- Day trading time frames – from 1-minute chart till 30 minutes chart time frame.
What are position trading time frames?
Position trading represents a style where traders keep their positions open for several weeks to months or years. Traders use Weekly and Monthly charts to set position trading orders. Position trading strategy is usually based on fundamental analysis and uses a broad stop loss.
The position trading strategy can vary greatly. For example, it can range from daily to yearly under the “long-term” definition.
New traders often avoid this timeframe since the trades stretch over extended periods. This means that it will take a long time before trades are realized. This can also benefit since many traders with a short-term approach (day traders) use strategies that can be problematic. Day trading takes a significantly more extended period to learn the right system.
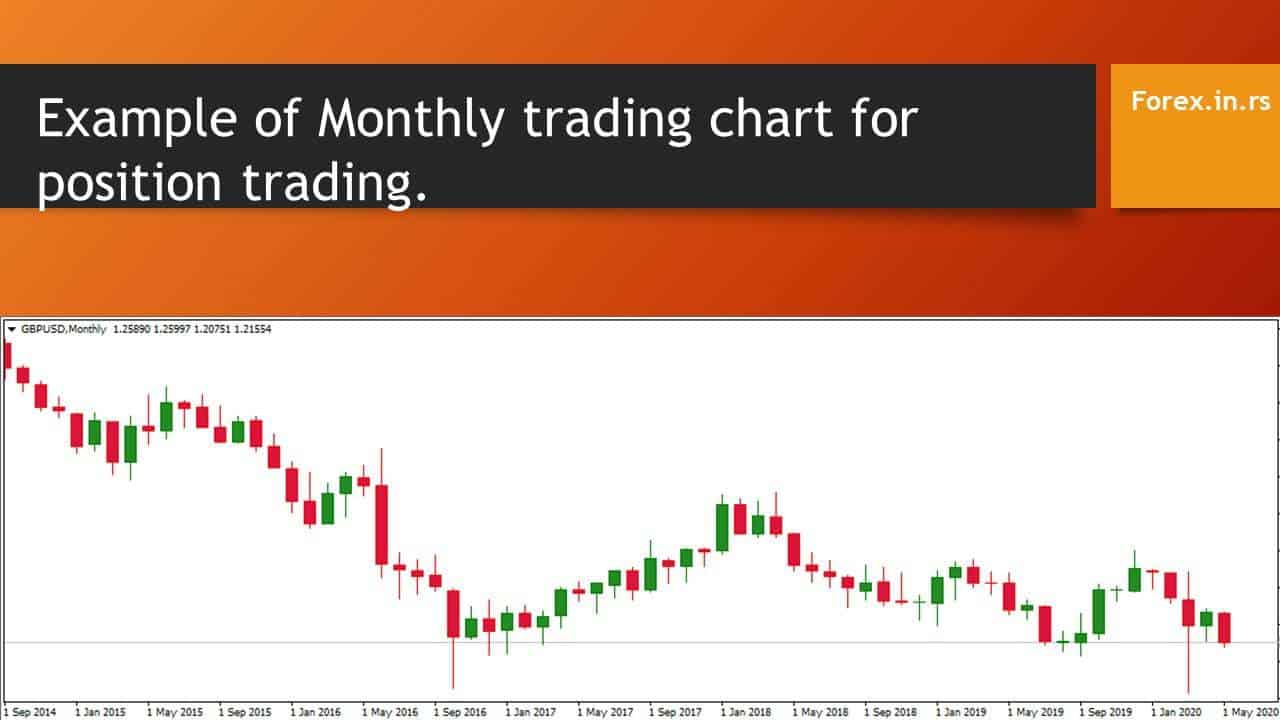
Traders who use the position trading time frame (long-term approach) can look to the monthly chart for trends and the weekly charts to spot buying opportunities.
Position trading example
So now that you know what it is, let’s review an example scenario. First, you would look at a monthly chart and analyze it to see the general trend. In this example, let’s say that the chart trend shows lower highs and lower lows, signifying a downward trend. After seeing this, you could look to enter a position on the weekly chart. You could determine good entry points by considering price action and technical indicators.
Swing trading time frame
Swing trading is a style that attempts to capture gains in any financial instrument over a few days (more than one day) to several weeks. Swing traders primarily work on four-hour (H4) and daily (D1) time frame charts, and they may use a combination of fundamental analysis and technical analysis to guide their decisions.
To see more about the best time frame for swing trading forex, visit our website page.
The following trading time frame is known as swing trading. After you get comfortable using long-term charts, you could consider switching your approach to a slightly shorter time frame. This means less holding time. However, this can introduce more variability and price fluctuation, so proper risk management is essential.
H4 (4-hour) time frame is often considered a favorable time frame for swing trading due to several reasons:
- Balanced Time Horizon: The 4-hour time frame balances shorter-term and longer-term perspectives. It provides a broader view of the market compared to shorter time frames like 1-minute or 15-minute charts, allowing traders to capture significant price movements and trends. At the same time, it is not as long-term as daily or weekly charts, making it suitable for traders who don’t want to hold positions for an extended period.
- Reduced Noise: Higher time frames tend to filter out some of the shorter-term price fluctuations and market noise that can be prevalent in lower time frames. This allows swing traders to focus on the more significant market trends and price patterns, which can improve decision-making and reduce the impact of short-term volatility.
- Adequate Trading Opportunities: The 4-hour time frame balances capturing significant price moves and generating trading opportunities. It allows swing traders to identify and participate in potentially profitable trends that may last several hours or days. In addition, this time frame can help traders avoid overtrading, as they don’t need to monitor the market constantly and can place trades at specific times during the day.
- Flexibility: The 4-hour time frame offers flexibility for traders who may have other commitments or cannot actively monitor the market throughout the day. With 4-hour candles or bars forming, traders have fewer instances to make immediate trading decisions, making it suitable for those who prefer a more relaxed trading approach.
- Confluence with Daily Time Frame: The 4-hour time frame often aligns well with the daily chart, as each 4-hour candle represents a quarter of a trading day. This alignment allows swing traders to assess the broader daily trends and potential support/resistance levels while focusing on the more detailed price action provided by the 4-hour chart.
Swing trading is suitable between day trading (a short-term approach) and position trading (a long-term system). Most swing trading strategies involve the open and close position in a few days. Swing trading is a relatively popular approach to trading the markets as it offers the benefits of both trading styles without all drawbacks.
Swing traders will typically check the charts a few times daily to identify significant movements. Unlike day traders, they are not glued to their screens all day. This offers much flexibility since they will not always watch the markets while trading. Instead, swing traders will usually take a position once an opportunity is identified. They can then set alerts to view how the work is done later.
A benefit of swing trading compared to long-term trading is that swing traders often look at the charts to identify suitable opportunities. Since they use weekly charts, these would likely not be seen as much for long-term traders.
After identifying a trade direction, most traders will switch their charts to the 4-hour view. This will allow them to identify good entry points. Traders will often analyze these charts to look for resistance levels. A good entry position could be when a candle closes above the resistance level.
Day trading time frame
Day trading refers to executing trades within the same day, with all positions closed before the market closes. Day trading time frames are M1, M5, M15, M30, and H1 charts. Day traders aim to take advantage of short-term price movements and volatility in various financial markets, including stocks, futures, options, and forex.
The last timeframe we will go over is the day trading time frame. The day trading time frame is perhaps the most popular one that new traders are excited to get into.
That said, day trading can be the most challenging time to find profitability. New traders practicing day trading must make frequent buying and selling decisions. New traders who are inexperienced and need to make regular trades open themselves up to more losses than if they were to go with a more long-term approach.
The day trading approach relies on small market fluctuations. This often requires day traders to stare at their screens to identify profitable trades. Long hours staring at a screen can cause fatigue. However, this short-term approach also offers a smaller margin of error.
When it comes to day trading, there is generally less profit potential. This means tighter stop levels. However, stricter stop levels can sometimes mean more losing trade compared to a longer-term approach. Therefore, I advise you to get comfortable with long-term and swing trading before starting day trading.
It cannot be denied that there are many advantages to engaging in various forex trading time frames. They become evident when comparing forex versus stocks. Due to the market’s robust liquidity about forex, traders can access short-term time frames and meaningful view information. On the other hand, when it comes to a stock that does not possess a high level of liquidity, the trader may not benefit from a short-term time frame, as it will not provide much new information in such cases that there has been no change in the price.
It is realized that another benefit of the usage of forex trading time frames is that the forex market runs twenty-four hours per day, each day of the week. Therefore, when applying various forex trading time frames during distinct trading periods, traders are presented with varied market conditions. For example, consider that this can allow for a range of markets during the Asian trading period. Or during the US and European crossover period, this can enable viewing of the trending markets. Traders are thus empowered to tap into the profitability of these distinct markets’ characteristics when they use different time frames to locate beneficial entries.
It is common for those new to forex trading to wonder if a specific forex trading time frame is more potent than others. Principally, accessing the best time frame for forex trading will depend on the preference of the trader’s trading style and the implemented strategies.
The best time frames for day trading and swing trading are different.
What is the best time frame for day trading?
The best time frame for day trading is 30 minutes because of optimal balance and the high confluence with higher time frames.
While the choice of time frame for day trading can vary based on individual preferences and trading strategies, some traders may find the 30-minute time frame appealing for several reasons:
- Optimal Balance: The 30-minute time frame balances shorter-term and longer-term perspectives. It provides a more comprehensive view of price action compared to shorter time frames like 1-minute or 5-minute charts, allowing traders to capture meaningful price movements and trends. At the same time, it is not as long-term as hourly or daily charts, which can help traders focus on intraday trading opportunities.
- Reduced Noise: Higher time frames, like the 30-minute chart, can filter out short-term market noise and volatility seen in lower time frames. This can help traders identify more reliable trends and patterns and reduce the impact of random price fluctuations.
- Adequate Time Intervals: The 30-minute time frame provides a reasonable interval for assessing market trends and making trading decisions. It allows traders to identify potential entry and exit points without constant monitoring. In addition, this time frame can accommodate traders who may have other commitments or prefer a less intense trading style.
- Compatibility with Intraday Strategies: Many intraday trading strategies, such as breakout trading or trend-following strategy, can be effectively implemented in the 30-minute time frame. Traders can utilize technical analysis tools, indicators, and chart patterns to identify potential trade setups and execute trades within the day.
- Confluence with Higher Time Frames: The 30-minute time frame often aligns well with higher time frames such as the hourly or daily charts. Traders can use these higher time frames for broader trend analysis and support/resistance levels while focusing on the more detailed price action provided by the 30-minute chart.
Day trading strategy uses lower time frames such as m1, m15, and m30 chart time frames and swing trading higher times such as H4 and daily chart.
Picking a trading timeframe will depend on your goals and style. All trading timeframes offer the potential for significant profitability as long as you are educated and comfortable with the positions that you are taking. Also, remember that you don’t have to use just one trading time frame. I like to use several time frames during trading and feel comfortable. The choice is yours.

He is an expert in financial niche, long-term trading, and weekly technical levels.
The primary field of Igor's research is the application of machine learning in algorithmic trading.
Education: Computer Engineering and Ph.D. in machine learning.
Igor regularly publishes trading-related videos on the Fxigor Youtube channel.
To contact Igor write on:
igor@forex.in.rs
