Table of Contents
Traders place various types of orders for making profitable trades. For placing different orders, a trader must consider and analyze many market data, as the market discounts everything every minute. Before jumping into the market, traders’ data is known as level 1 and level 2 market data. If you think about level 1 and 2 market data, this article is your answer.
Market data levels represent information about current prices and recently completed trades. For example, market data level 1 displays the best bid-offer-volume quotes in real-time—market data level 2 displays as same as level 1 plus the market depth and order book. Market-level 3 represents the highest level of quotes a trading service provides, allowing it to enter quotes, execute orders, and send information (unites market data level 1 and market data level 2).


Please check my video that will explain Market level data 1,2 and 3:


If you trade stocks using platforms, you will have Market data Levels:
- Bloomberg Terminal
- Reuters Eikon
- TradingView
- Interactive Brokers
- TD Ameritrade
- Robinhood
- E*TRADE
- Charles Schwab
- Fidelity
- Ally Invest
In various types of market data, there is information regarding current market rates and recent trades. Compared to the Level I data, Level II data gives more information. Traders can subscribe to their preferred data set through their brokers. The cost of both data sets is different and depends on the broker. Before choosing a data Level, you must be aware of all the other data provided by that Level on your feed, so you pay only for what you can use.

What is Level 1 Market Data?
Level 1 market data displays the best bid-offer-volume quotes in real-time and gives information about bid price, bid size, ask price, size, last price, and last size.
See the market data level 1 example video:
When you get basic information related to the market, it is considered Level I market data. It helps traders take trades based on charts, price actions, and indicators. The following terms are associated with the Level I sell data.
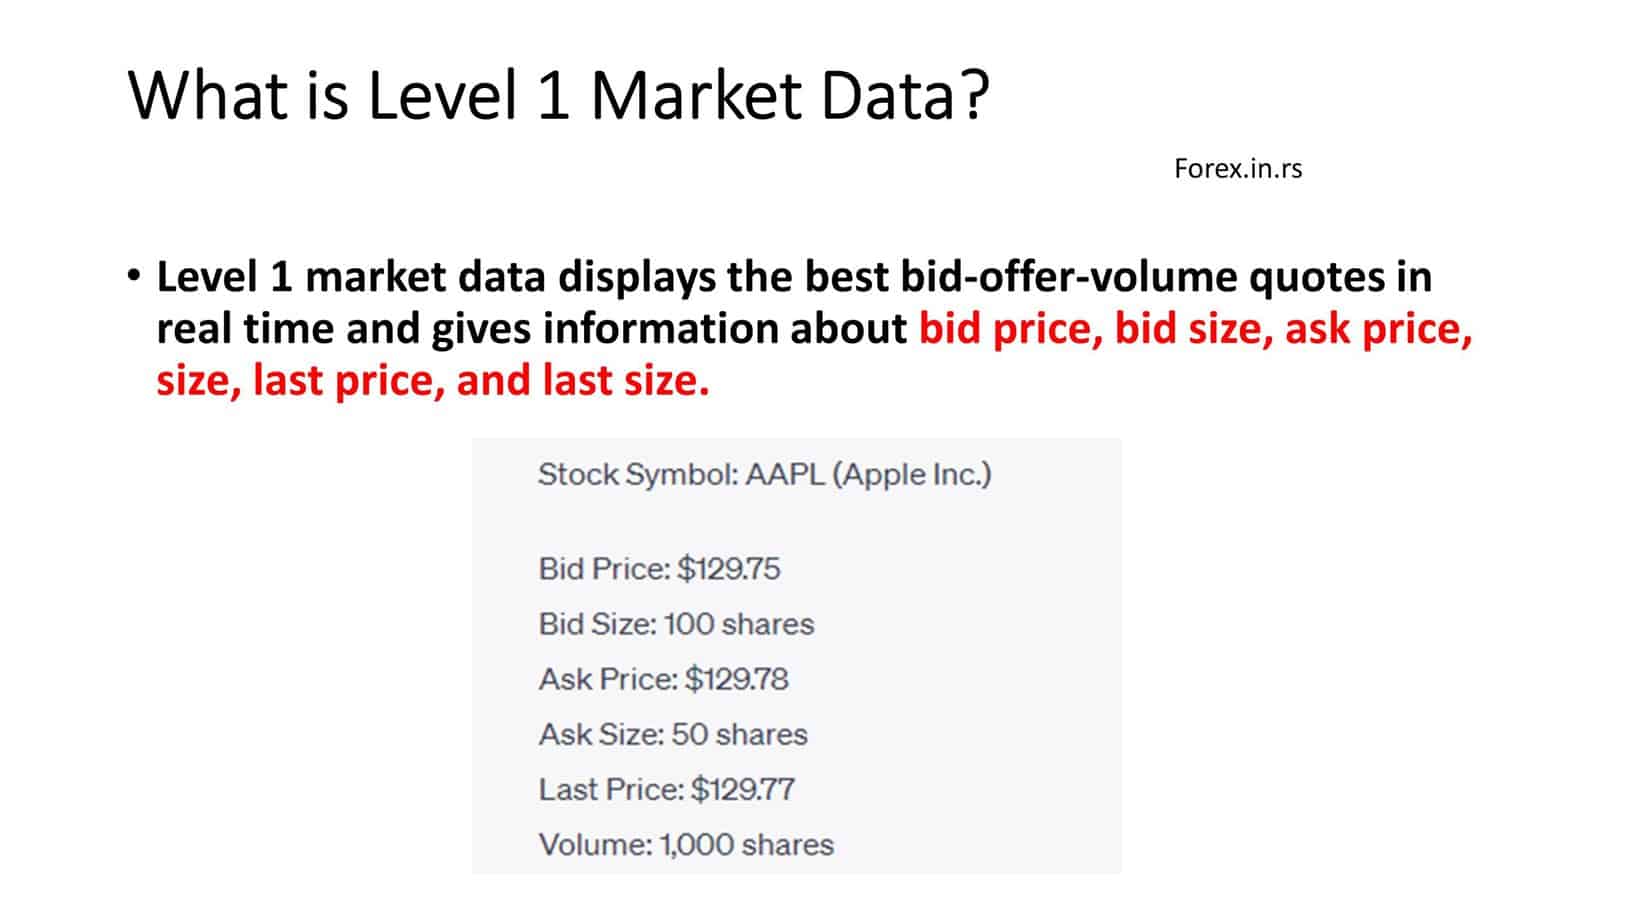
- Bid Price The highest rate at which a trader will likely purchase the financial asset.
- Bid Size: Depending on the financial market, the total number of shares, currency pairs, or contracts traders are buying at the bid price.
- Ask Price The lowest rate at which a trader will likely sell a financial instrument. It can also be said the offer price is.
- Ask Size Depending on the financial market, the number of shares, currency pairs, or contracts; traders sell at the asking price.
- The last Price, The last rate of the previous transaction, is executed in the market.
- Last Size Depending on the financial market, the total number of shares, currency pairs, or contracts sold in the last transaction.
Traders or scalpers trading on changes occurring because of other traders’ bidding and asking rates prefer using Level II data to provide more profound and multiple information on the market.
What is Level 2 Market Data?
Level 2 market data displays the best bid-offer-volume quotes in real-time, market depth as the magnitude of buy and sell orders at different prices, and order book where most orders are concentrated among market makers.
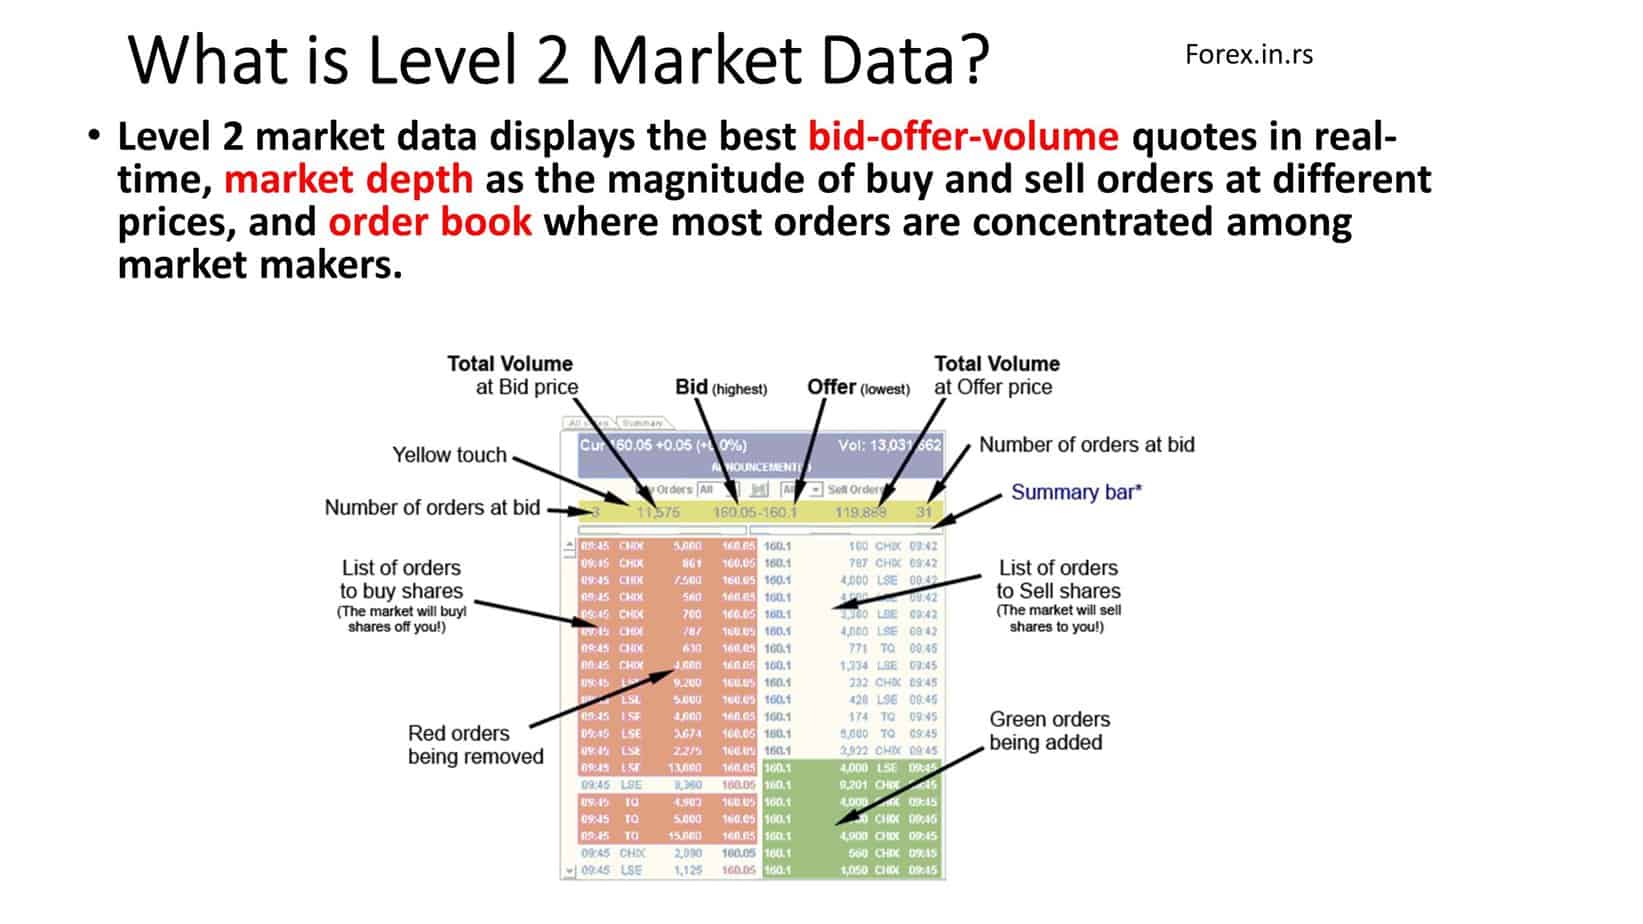
Market Level 2 data provides traders more detailed information about a stock’s order book and trading activity than Market Level 1 data. Some critical information Market Level 2 data provides includes bid-offer volume, market depth, and the order book.
Bid-offer volume refers to the total number of shares buyers are willing to buy (bid volume), and the total number of shares sellers are willing to sell (offer volume) at a particular price level. This information is displayed in Market Level 2 data and can be used by traders to assess the supply and demand for stock at different price levels.
Market depth refers to the number of buy and sell orders at different price levels beyond the current bid and asks prices. Market depth is also displayed in Market Level 2 data and gives traders an idea of how much buying and selling activity occurs at different price levels. Traders can use this information to identify potential support and resistance levels and to make more informed trading decisions.
The order book records all the buy and sell orders placed for a particular stock, along with the price and volume of each order. The order book is also displayed in Market Level 2 data. It can provide traders with valuable information about the supply and demand for a stock and the sentiment of other traders. In addition, traders can use the order book to identify potential support and resistance levels and gauge the strength of the market for a particular stock.
As Level II gives data on the higher bids and asks prices and a lot more, it is more valuable than Level I market data. Therefore, the following information is related to the Level II order book.
The main difference between level 1 and 2 market data is the available information.
Market Level 1 data provides basic information about a stock’s trading activity. In contrast, Market Level 2 data provides more detailed information about the order book and market activity that is only available to professional traders.
Level 1 market data, also known as Level 1 data, provides the most basic information about the market, including the current bid and ask prices, trading volume, and the last traded security price. This information is typically available to the public for free or a small fee and is commonly used by retail traders and investors to make buy and sell decisions.
Level 2 market data, or Level 2 data, provides more detailed information about the market, including the current bid and ask prices and the market depth at each price level. This means that Level 2 data provides information about the number of buyers and sellers at each price level and the size of their orders. This information can be valuable for traders looking to execute large trades, as it can help them identify areas of support or resistance in the market.
The main difference between 1 and 2 market-level data is the available information. While Level 1 data provides basic information about the market, Level 2 data provides more detailed information about the depth of the market, which can be helpful for traders looking to execute large trades or trying to identify areas of support or resistance in the market.
Market 3 data level
Market 3 data level provides all the information and services of level 1 and level 2 quotes, plus the ability to enter or change selections, execute orders, and send out confirmations of trades. Level 3 service is restricted to National Association of Securities Dealers (NASD) member firms.
Traders can also combine this perspective with recent transactions; if the trades are executed at the bid price, there are chances of prices going down for the short term. If the transactions are conducted at the asking price, there are chances of prices going up in a short time. Per the knowledge and preferences, a trader can mix and match various trading strategies.
So as you know, Level II data is also known as a Level II order book, as it represents all the orders that are executed and are in the waiting line in the market. It is also known as market depth, as it shows the volumes of all the transactions. However, a transaction is executed only when both parties agree to trade at a specific price.
How to Use Level 2 Market Data?
You can use Market 2-level data to confirm support and resistance price levels, Watch Market Depth, and Identify Market Makers. For example, combined with technical analysis and chart price levels, 2-level market data can confirm important price levels.
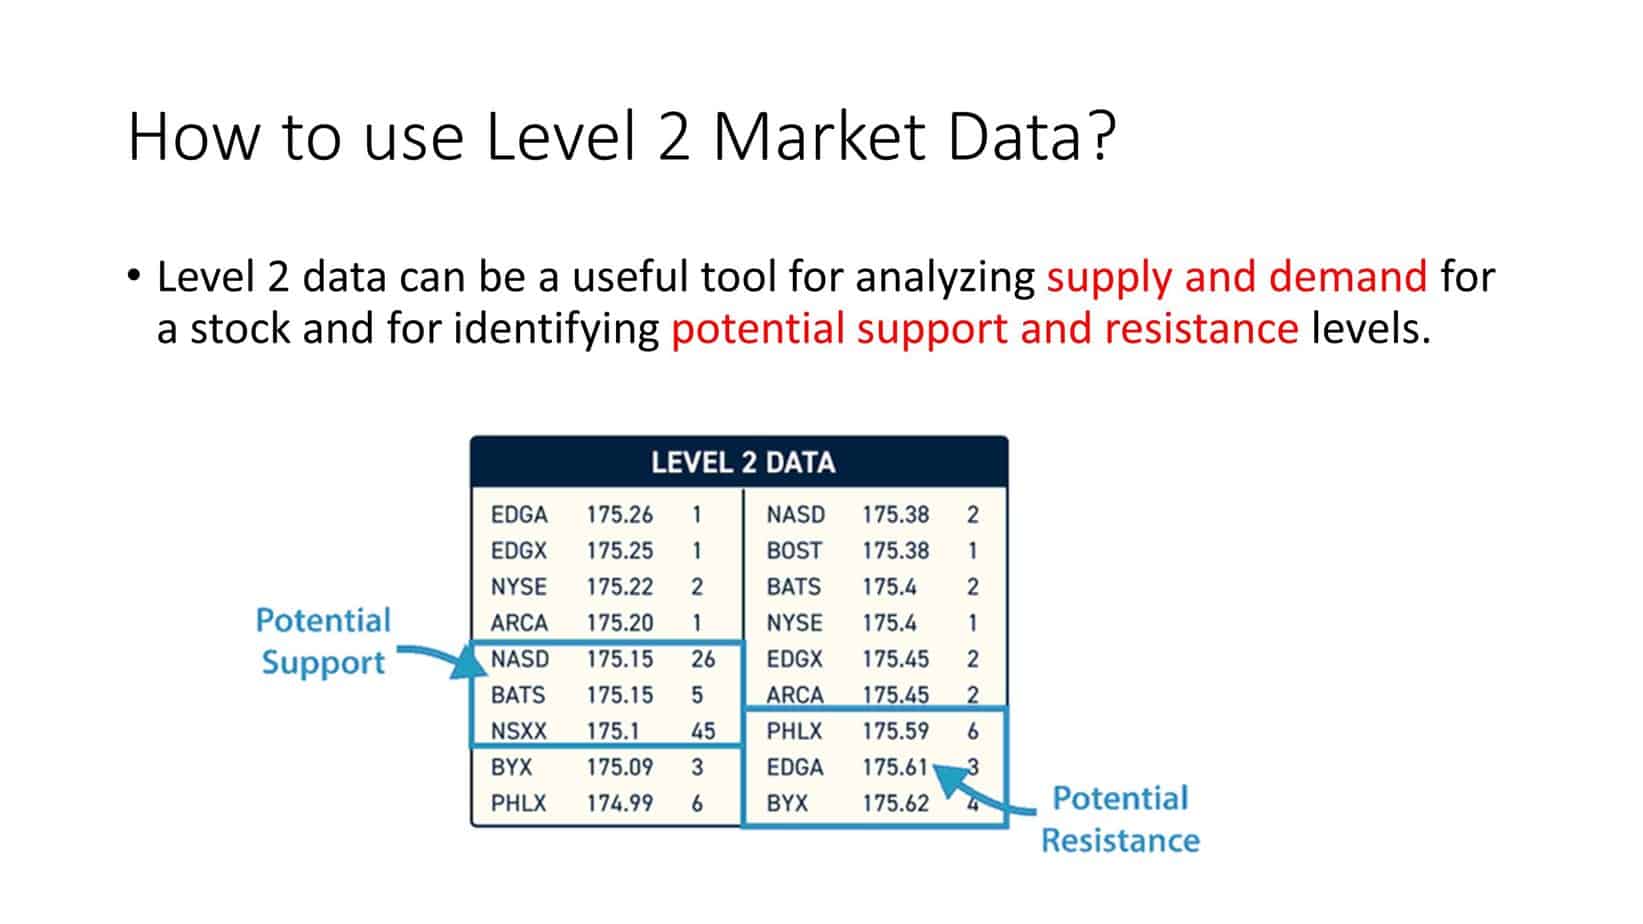
The image above shows that the 26, 5, and 45 orders number indicate that the price of 175.15 is potential support (other numbers are small). If the chart confirms this information, traders can enter a trade at the proper price level.
Support levels are areas where buying pressure is strong enough to prevent the price from falling further. In contrast, resistance levels are areas where selling pressure is strong enough to control the price. By looking at the Level 2 data, you can see how many orders are waiting to buy or sell at certain price levels. If there is a large number of buyers waiting at a particular price level, it indicates strong support. In contrast, a large number of sellers waiting at a specific level of price indicates strong resistance.
Another way to use Level 2 data is to watch market depth. This refers to the number of orders waiting at each price level in the queue. By looking at the market depth, you can see how many orders are waiting to be filled at a specific price, indicating market liquidity. This is important because if there are not enough buyers at a particular price level, it can lead to a sharp drop in price if a prominent seller suddenly enters the market.
Finally, Level 2 data can help you identify market makers. Market makers are firms or individuals that provide liquidity to the market by buying and selling securities at prevailing market prices. By looking at the Level 2 data, you can see which brokers offer liquidity to the market and identify any patterns or anomalies in their behavior. This can help you anticipate market movements and make informed trading decisions.
Using Market Level 2 data effectively requires understanding how it works and what information it provides. Here are some tips for using Market Level 2 data in stock trading:
- Monitor Bid-Ask Spreads: Pay attention to the bid-ask spread, which is the difference between the highest price a buyer is willing to pay for a share (bid) and the lowest price a seller is willing to accept for a claim (ask). A narrow bid-ask spread indicates a liquid market and suggests that the stock may be easier to buy and sell.
- Watch Market Depth: Market depth measures the volume of buy and sell orders at different price levels. Monitor market depth to identify potential support and resistance levels and assess the market’s strength for a particular stock.
- Look for Order Flow: Order flow is the buying and selling activity volume at different price levels. Use Market Level 2 data to track order flow and identify buying and selling activity trends.
- Identify Market Makers: Market makers are firms that provide liquidity to the market by buying and selling shares. As a result, they play an essential role in Market Level 2 data and can help traders identify potential trading opportunities.
- Combined with Technical Analysis: Market Level 2 data can be used with technical analysis to identify potential entry and exit points. For example, traders may use Market Level 2 data to confirm a breakout or to identify possible support and resistance levels.
The Bottom Line
If you wonder where the market data comes from, the answer is financial exchanges. For example, NYSE (New York Stock Exchange) is known for providing Level I and Level II market data for stocks listed on its platform. In addition, traders can also gain such vital data sets from their brokers. It is easier to get both data sets for stocks and futures, though, for forex, only a few brokers offer Level II market data.
There is no doubt that Level II data costs more than Level I data. Though some brokers provide these data sets for free, you have to pay them a little higher commission. At the same time, forex brokers do not charge for Level II data.
As a trader, you need to know what information affects the market and how you can take advantage of that by educating yourself. Knowledge is the key here to open the locks of future gains. You would soon become a pro from a novice by learning and implementing.

He is an expert in financial niche, long-term trading, and weekly technical levels.
The primary field of Igor's research is the application of machine learning in algorithmic trading.
Education: Computer Engineering and Ph.D. in machine learning.
Igor regularly publishes trading-related videos on the Fxigor Youtube channel.
To contact Igor write on:
igor@forex.in.rs
