Table of Contents
Renko charts are a type of financial chart which can be used to track a variety of assets, such as stocks, commodities and currencies. They are constructed by placing a brick in the next column once the price surpasses the predefined threshold. The chart is named after the Japanese term “renga” which means “brick”.
Unlike other types of charts, such as line and candlestick charts, Renko charts do not factor in the time element since they show only the price movements without taking into account when these price changes occurred. This makes it easier for traders to identify strong trends and make buying and selling decisions based on them. Each brick in the chart has an equal size and represents a specified amount of points or pips that have been gained or lost by the asset being traded. By eliminating time from their analysis, traders can focus solely on price movements and accurately predict where they will go next.


What is Renko Chart?
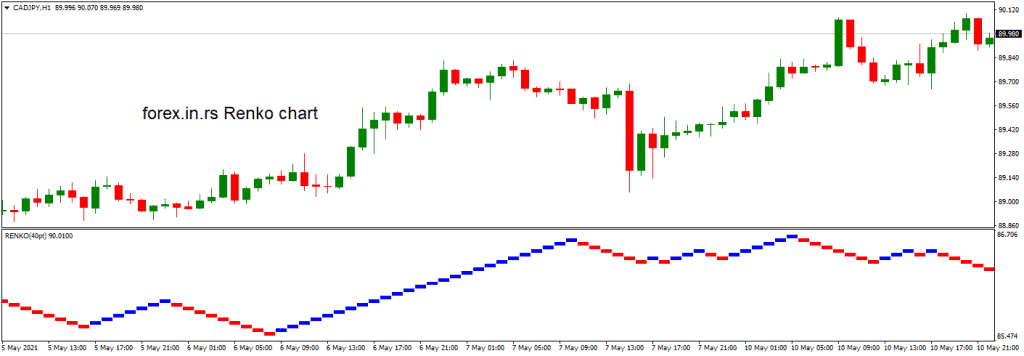
Renko chart represents a chart formed by bricks (blocks) that only measure price movement. Each time the rates fluctuate for a particular number, another brick is added, every single block is adjusted at 45° (upward or downward) about the previous one.


Unlike other charts, a chart made by the Japanese, with the help of rate fluctuations instead of rates and standard timing, is stated as Renko Chart. As per its appearance, like a sequence of bricks, the chart is titled from the word “renga,” which means brick in Japanese. Each time the rates fluctuate for a particular number, another brick is added, every single block is adjusted at 45° (upward or downward) about the previous one. We can differentiate the upward and downward bricks by their colors. They are colored white/green and Black/red, respectively.
What is candlestick brick?
Renko charts use price “bricks” instead of standard candlesticks representing a fixed price move. So, for example, if the brick value is set to 20 points, a movement of 20 points or more is required to draw another brick.
In order to use Renko charts effectively, it is important to understand how they work. First and foremost, you need to define your threshold or box size, which is the amount of points or pips that must be gained or lost before a new brick is placed in the chart. The box size helps traders decide how many pips they want to see per brick so that they can better assess where support and resistance levels might be located within their trading system.

Once you define your box size, you can then begin plotting your Renko chart using either an automated trading platform or manual entry techniques. Automated platforms provide users with up-to-date data on their chosen asset so that they can make better trading decisions without having to manually analyze each new piece of data themselves. Manual entry techniques involve entering each new point or pip yourself using simple arithmetic calculations based on previous prices of your chosen asset over time.
Once the Renko chart has been plotted out according to your set criteria, traders can begin studying it for areas of support and resistance as well as any potential breakout patterns that could indicate an upcoming trend reversal or continuation. If there appears to be a strong trend forming with multiple bricks going in one direction (either up or down), this could signal a good opportunity for entry into a trade if it aligns with any other technical indicators you may be using at the same time such as Ichimoku clouds or moving averages convergence/divergence (MACD).
Renko chart vs. candlestick
The difference between the candlestick and Renko charts is that the candlestick chart shows the last price while a Renko chart shows the price that created the last brick. Thus, Renko charts do not indicate precisely the high or exactly low of an asset.
How do Renko charts work?
Renko charts work as indicator which filter out minor price movements identifying support and resistance levels using blocks adjusted at a 45° angle. Main characteristics are:
- A Renko chart is made of blocks (bricks), adjusted at a 45° angle about the other.
- The value of a block can be of any range, like $0.10, $0.50, $5, and further. It is known as box size. The size of a box can also depend upon ATR (Average True Range).
- A Renko chart consists of specific durations, yet a duration cycle is not locked. The formation of a few bricks can take more time compared to others. It depends on the time consumed by rates to reach a specific level.
- A Renko chart proves helpful to dealers, as it refines noise and specifies the direction as all narrow activities are refined and executed.
- A Renko chart always prefers closing prices, depending on the selected duration cycle. For example, if you utilize a week-based duration cycle, closing rates will be chosen per the weekly duration cycle.
Download Free Renko Chart Indicator
Please download the free Renko chart indicator for MT4!
Renko charts are formed to eliminate minor rate differences and make it simpler for dealers to concentrate on significant deals. As a result, it becomes simpler to figure out directions, but there is one downfall: it also clears few pricing data because of simple block formation.
An initiative towards forming Renko charts is to select a box size that indicates the significant rate of activities. For example, if an asset has a $0.25 block size, a coin might have a 50 pip block size. Then a Renko chart is formed by adjusting blocks in the next column as the value has passed the leading or last of a block before the size of the case.
In the case of an asset, let’s consider a share traded at $10, and its block size is $0.25. Now, in case its value goes up to $10.25, the latest brick would be made. Another will be formed only when the weight is $10.25 or greater. Even If its value hits up to $10.24, a renga will not be created. As brick is formed, it can’t be erased further. Later on, if its value goes up to $10.50 or greater and closes, one more brick will be formed.
Rengas are not formed next to one another. Thus, if the asset falls to $10.25, a brick will not be constructed beside the upper block. If its value drops to $10, you’ll observe a renga underneath the last brick.
For a general decided box size, ATR is utilized. However, ATR aims to get volatility measurements, and as a result, it varies in respect to time. Therefore, ATR-dependent Renko charts will apply wavering ATR values for the block size.
As we know that the Renko chart has no fixed duration; then, in this case, a single brick can take several months to build, whereas plenty of bricks can be formed in a single day. Therefore, this can be considered a difference between Renko, candlestick and bar charts, in which the latest bar/candle can be formed at particular timing.
Increment or decrement in the block’s dimensions can make a difference to the “smoothness” of the Renko. For example, more swings will be created as the block size decreases, and significant turnabouts in rate will also be noticed. Conversely, a larger box will not indicate many swings but will prove slow to show turnabouts.
These charts efficiently analyze resistance level and support as there is little noise compared to a candlestick chart. Additionally, as a rigid direction is obtained, Renko dealers will get a chance to go a long way before any block formation in the inverse direction.
Renko volume parameter doesn’t exist. Therefore, traders need to combine volume indicators with Renko charts to analyze price and volume simultaneously.
Dealing indications are particularly received when the sight for movement differs and the blocks change colors. For instance, a dealer would dispose of their share once a red box is observed posteriorly passing through several white blocks. Similarly, if there is an upward movement, a dealer will enter once the white or green boxes are observed posterior to a red box or two.
How to backtest Renko charts?
To backtest Renko charts, you need to use Visual mode in Metatrader Tester. You can develop any strategy, pick wished time frame in the MT4 tester, and monitor performance in Visual mode. However, you can have smaller accuracy if you create a scalping or intraday strategy.
Renko swing trading
The best Renko chart settings for swing trading set the number of pips equal half the current daily average true range (ATR). For example, if the daily average true range is around 100 pips, then 50 pips can be ideal for the Renko chart for swing traders.
Swing traders use very often H4 chart time frame, and the average stop loss is around Daily ATR/2.
Let us give one example.
Renko indicated a rigid upward move in the market with a $2 box size. Blocks are formed depending on the price, and movements lesser than $2 are not considered. A deep pullback appears as a red box, and later the green boxes are also observed. As a rigid upward movement is experienced, it can be a chance for entering a longer path. Once a red box is marked, take an exit.
Once you experience upward movement, a rigid downward moment is built. Similarly, this strategy can be applied for entering short. Hold up till you observe a pullback, indicated by the green box. As the red block is formed, be prepared to get in the shot because the rates can still descend by the long-term downfall. Slip off once the block goes up.
The above given are practical information. Few dealers want to observe two or more bricks consecutively in a specific direction before exiting or entering.
Heiken Ashi vs. Renko
While Heiken Ashi takes an average of open, high, lows, and close, Renko’s chart only measures the current price move. So, Ashi measures past and current price movement differently from Renko charts. Therefore, Ashi charts have a time and price movement component, while Renko charts only price movement.
The Heiken Ashi chart is also made in Japan. The chances of its appearance are the same as the Renko chart, indicating movement prolonged in an upward or downward direction. The Renko charts utilize a decided amount of boxes. Whereas Heiken Ashi charts take an average of open, highs, lows, and close on present and previous times. Hence, each candle and box are different in dimension and indicate the average rate. Heiken Ashi charts & Renko Charts both help similarly denote movements.
Renko charts Thinkorswim
TOS Renko charts represent charts on Thinkorswim that can be easily added using indicators. However, if you need code to add Renko candles at Thinkorswim partner, please use this code below:
TOS Renko charts – script to draw Renko candles
Thinkorswim is a platform different then Metatrader.
How to calculate Renko bars manually?
To calculate Renko bars please use the following formula:
def c = close;
def bricks = CompoundValue(1, if c > bricks[1] + brickSize
then bricks[1] + brickSize
else if c < bricks[1] – brickSize
then bricks[1] – brickSize
else bricks[1] , bricks[1]);
Renko charts disadvantages
Renko charts display less information than bar charts or candlesticks, making them less dependable. For example, an asset ranging for a more extended period might be shown within a box, resulting in incomplete information. Renko charts do not offer high and low assets like candlesticks charts.
Read more about Renko charts disadvantages in our article.
Only current rates are considered; ups and downs are neglected as well. Because of this, many vital reports are missed, as ups and downs may differ compared to closing value. Closing values may lower noise, although it can naturally deform the value even before the recent box formation and warns the dealer. But, in this case, it gets late enough to sneak out before you make a loss. That is why many investors still apply stop loss at decided values while still using Renko Charts.
As such charts are formed to pursue regular movement of rate, one can get unreal indications as the color of brick can differ faster, generating a whipsaw effect. Hence, if you utilize Renko charts, use them in affiliation with other professional studies.
Renko Trading Strategy Rules
These charts are genuinely beneficial, and with the right strategy, you can execute their usage successfully.
Below are four simple rules of trading that make this system very accurate:
- If the old brick of Renko is green/red when a significant change is predictable, the chances that the price may go high/low are pretty much present.
- The success probability is higher than the candlestick chart with double bottom and double top.
- To confirm any breakouts go for the rule of two bricks. The breakout will be extended if two constant bricks are closing above/below the resistance or critical support level.
- Divergence in trading on the chart of Renko is quite assisting when finding reversing patterns.
Conclusion
Overall, Renko charts can provide traders with valuable insight into their chosen asset’s current market conditions which can help them make more informed decisions when entering positions in the market.
By eliminating distractions from noisy prices caused by noise from traditional candlestick charts, Renko charts allow traders to hone in on specific areas of strength and weakness within price support levels so that they can better capitalize upon profitable opportunities when they arise.
With practice however, even novice traders should have no trouble understanding how Renko charts work in order maximize their success while trading different assets across various markets around the world today!
I suggest you read our article to learn more about is forex trading is profitable!

He is an expert in financial niche, long-term trading, and weekly technical levels.
The primary field of Igor's research is the application of machine learning in algorithmic trading.
Education: Computer Engineering and Ph.D. in machine learning.
Igor regularly publishes trading-related videos on the Fxigor Youtube channel.
To contact Igor write on:
igor@forex.in.rs
