Renko charts, or brick or box charts, represent an asset’s price action. Although they can be beneficial for technical analysis, it is essential to be aware of the disadvantages of Renko charts so that you can use them correctly and take precautions when necessary.
To download the Renko chart indicator, please visit our page.
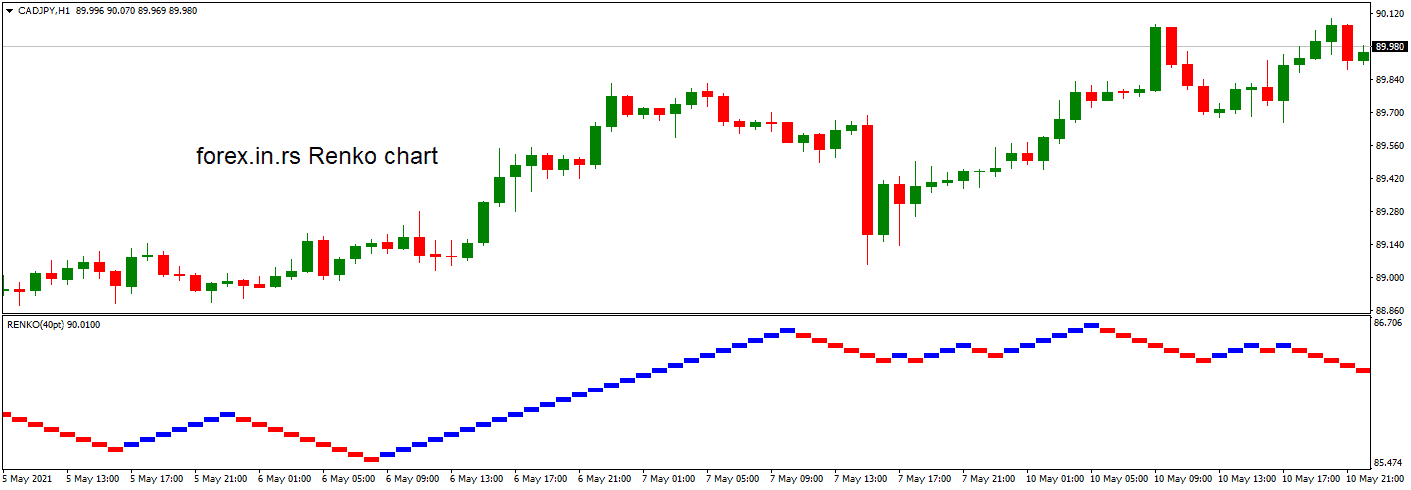
Renko Charts Disadvantages list
- Lack of detail: Renko charts only show price movement based on a fixed price increment or “brick” size, which can lead to a lack of detail in the chart. This can make identifying trends, support, resistance levels, and other critical technical indicators challenging as pro traders do.
- Delayed signals: Renko charts are based on price movement, so they may not always be as responsive to market changes as other charts. This can result in delayed signals that may cause traders to miss out on opportunities.
- Limited customization: Renko charts have fixed brick sizes and timeframes, which can limit the trader’s ability to customize the chart to their preferences. This can disadvantage traders who prefer more flexibility in their charting tools.
- Not suitable for all markets: Renko charts are most effective in trending markets and may not be as valuable in range-bound markets or experiencing choppy price action. Traders need to be aware of this limitation when using Renko charts. For example, I think Renko charts are unsuitable for commodities trading such as gold.
- Requires adjustment: Renko charts require periodic adjustments to maintain accuracy, which can be time-consuming for traders. This adjustment is necessary to account for changes in volatility or market conditions affecting the brick size and timeframe.
- Limited historical data: Renko charts are based on price movements, so they only show data for the period in which the chart has been used. This can limit the trader’s ability to analyze historical trends and patterns, disadvantaging long-term traders.
A significant disadvantage of Renko charts is that they may not accurately reflect the actual trend in the market. This is because a Renko chart only considers the price changes and ignores the time factor. For example, if an asset experiences several consecutive price increases in a short period, these would be represented on a Renko chart as one long line heading up. However, the underlying trend might not be upward but a short-term spike that could revert to normal levels soon after. Therefore, traders must be careful not to mistake a short-term spike for an uptrend when looking at Renko charts.


Another disadvantage is that Renko charts generally lack volume information. Volume data is essential in technical analysis as it helps traders to identify potential reversals and confirm trends. Without this information, making decisions based on what you see on the chart is difficult.


Lastly, although Renko charts help filter out noise from the market, this filtering process can also lead to traders missing out on potentially profitable trading opportunities. This is because some signals that appear insignificant using a regular bar or candlestick chart might be significant when viewed with higher granularity over a more extended period – something that isn’t visible on a Renko chart.
For example, if there were two consecutive days where the price increased by 5 points each day, then this might not seem like much when viewed with a standard chart; however, if you zoomed right into those two days, then you may have noticed smaller patterns within those two days which would have suggested further upside potential going forward – something which you wouldn’t have picked up on with just a regular bar or candlestick chart due to its lower granularity level.
Overall, although Renko charts can be highly effective tools for technical analysis, there are some disadvantages associated with them, such as their lack of accuracy in depicting actual trends and their inability to accurately measure volume data or pick up minor details which may suggest further upside potential in the future – something which traders need to keep in mind when using them so that they don’t miss out on any potentially lucrative trading opportunities due to reliance solely on this type of charting tool alone.


He is an expert in financial niche, long-term trading, and weekly technical levels.
The primary field of Igor's research is the application of machine learning in algorithmic trading.
Education: Computer Engineering and Ph.D. in machine learning.
Igor regularly publishes trading-related videos on the Fxigor Youtube channel.
To contact Igor write on:
igor@forex.in.rs
Related posts:
- How Do Renko Charts Work? – Download Free Renko Chart Indicator
- Are Renko Charts Profitable?
- Renko vs. Heiken Ashi!
- Does Metatrader 4 Have Footprint Charts?
- How to Read Forex Bar Charts?
- How to Read Forex Charts?
- Seconds Charts TimeFrames in MT5 – 1 Second or 10 Seconds TimeFrames Charts
- What Platforms Have Less than 1 Min Charts Time-Frames?
- The Best Stock Ticker – Live Market Charts Free
- How To Move Your MT5 Charts Like in Tradingview Using Scale Fix?
- How to Compare Charts on TradingView?
- What is Tick Data in Forex? – Tick charts
