Table of Contents
Every severe trader knows the importance of a candle pattern. One such pattern is the inside bar pattern. Within the financial markets, it occurs regularly. By incorporating this particular pattern within a trading system, you can significantly enhance your market analysis technique. Read along to know what this bar pattern has to offer to you.
Defining an Inside Bar Pattern
What is an inside bar pattern?


An inside bar pattern represents a two-bars pattern where the second bar has a price range that is completely inside the first day’s price range. The inside bar (the second bar) is smaller because the high is lower than the first bar’s high, and the low is higher than the first bar’s low. Usually, trends will continue to follow major trends that follow the first candle.


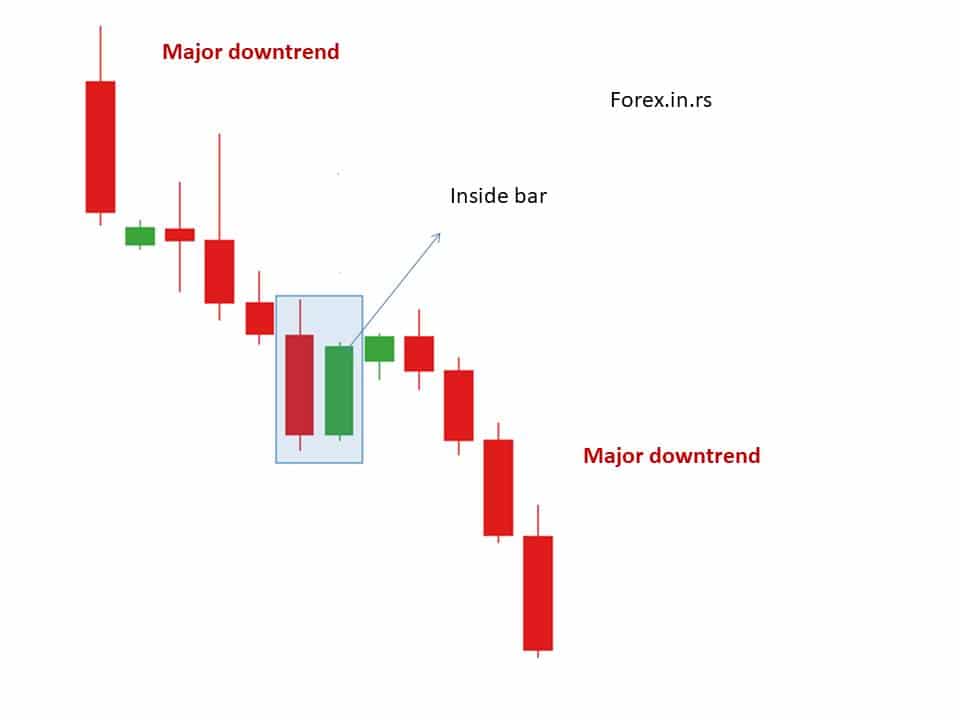
One of the famous continuation/reversal candle formations is the inside bar. It requires no more than two candles to present themselves. The inside bar pattern is a direct play that could be used on short-term market sentiment, especially if you are looking to enter the market before the big moves in the market.
The inside bar shows how reluctant the prices are to progress below or above the high or low formed by the preceding candle, which indicates market indecision.
Identifying an Inside Bar
If you want to identify the formation of this bar on the Forex charts, you can use the following steps:

- Use technical indicators or price actions to identify preceding trends.
- Look for the point where the inside bar is completely engulfed by the previous candle, low or high.
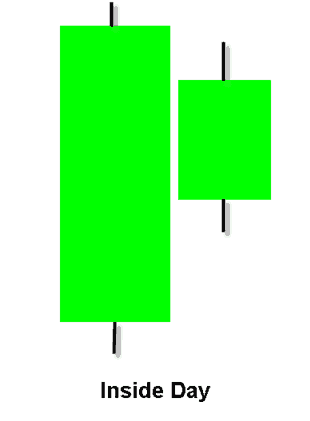
What is an Inside Day Candle Pattern?
An inside day candle pattern implies a two-day price pattern where the second day has a price range that is completely inside the first day’s price range. Price after the second day usually continues to move in the major direction (continuation pattern).
How to Use the Inside Bar Pattern for Trading?
There are many ways in which you can upgrade your trading strategies using this candlestick pattern. We are sharing the top strategies and tips with you.
It is regarded as a continuation pattern by some traders even though it is possible to see a breakout in the opposite direction. After the prices have trended down or up for a considerable period of time, a pause in the movement of the prices precedes a trend reversal. Since the inside bar pattern represents the pause, traders use it for short-term trades or swing trading done in the counter-direction. The goal here is to hold a particular trade for less than ten bars.
This is not the only way of using this candlestick pattern for trading. The other way has its foundation in the information that is not revealed by the inside bar pattern. The formation of this pattern tells the traders that the market is unwilling to push the prices in either direction. They are neither going up nor down. Stagnation in the prices could happen for several reasons, like:
- A significant report is about to the issued.
- The market has witnessed a significant leap, making traders wary of bidding prices too low or high.
Irrespective of the reason, every trader has the same motive; to seek potential volatility to further the profits. When the market is stuck in limbo, traders are unwilling to break the existing prices by bidding higher or lower; it could be seen as a potential sign of volatility that will be heightened in the future. In this case, the inside bar is not telling us about the stock prices; rather, it informs us that the market is currently waiting for something big to happen in the future. Traders should hold their horses and get active when these potential opportunities present themselves.
The Breakout Strategy of the Inside Bar
The inside bar shows us short-term consolidation within a trending market where the volatility is at a low. In this situation, the traders are looking out for a breakout once a new high or low has been formed in the market.
Is the Inside Bar Pattern Reliable?
Let’s begin this answer by stating an obvious fact; nothing is absolutely reliable in the world of trading. All the technical indicators are prone to glitches and manipulation, and the inside bar pattern is no different. If we keep aside the general warning aside, there is a lot that an inside bar pattern can offer to the trader. Reversals or continuation signaled by this pattern makes it complex. In addition to that, you can also see false breakouts that lessen its reliability. This can be overcome if you use this pattern with other indicators or part of your overall trading strategy.
On the positive side, this candlestick is new-trader friendly. Unlike other indicators and patterns that are difficult to understand, this bar is quite straightforward. It occurs frequently and offers favorable risk-reward ratios.

He is an expert in financial niche, long-term trading, and weekly technical levels.
The primary field of Igor's research is the application of machine learning in algorithmic trading.
Education: Computer Engineering and Ph.D. in machine learning.
Igor regularly publishes trading-related videos on the Fxigor Youtube channel.
To contact Igor write on:
igor@forex.in.rs
