Table of Contents
This trend-following indicator is very reliable. It guides forex traders about the direction that prevails or begins. Moreover, a non-repainting MT4 indicator provides buy and sell signals.
What is a Half Trend Indicator?
The half trend indicator represents the MT4 trend indicator that draws BUY and SELL signals based on moving average intersection. The indicator draws bearish and bullish invalidation zones on the chart and marks a trend shift. The Blue arrow represents the “Buy” signal while the red arrow “Sell” signal.


A half-trend indicator represents a technical tool that employs moving averages and price data to identify potential trend reversals, displaying the results as graphical arrows that signal market turning points. Key features include its reliance on moving averages, its role as a momentum indicator, its ability to flag trend changes, detect bullish or bearish reversals, offer buy/sell signals, and its real-time analysis capability.


Download the Half Trend Indicator for MT4 below:
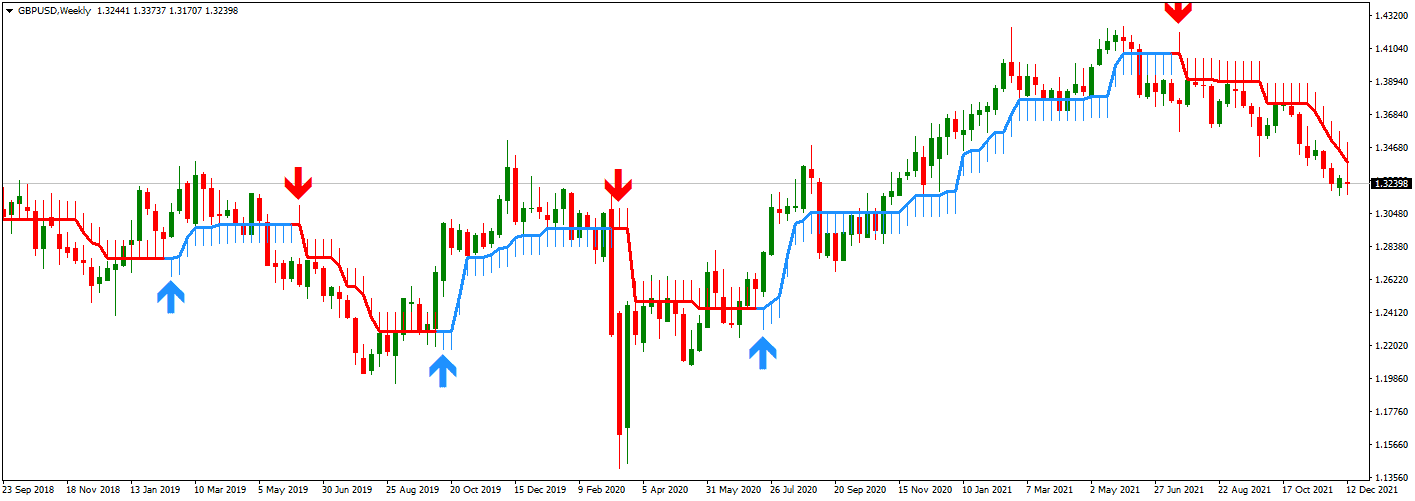
The chart above shows that the half-trend indicator comprises two primary components: the half-trend line and arrows. The half-trend line, visualized on a candlestick chart, signifies the market’s real-time trend based on moving averages; it has a red line for bearish trends, indicating seller domination, and a blue line for bullish trends, showing a buyer-heavy market.

These are arrows: blue arrows suggesting a buy signal and red arrows indicating a sell, which, when combined with the trend line, provide traders with strategic entry and exit guidance.
Half Trend Indicator Working Principle
The half-trend indicator harnesses this Principle and amplifies its utility by incorporating specific types of moving averages. It uses the Relative Strength Index (RSI) oscillator and the Exponential Moving Average (EMA). The RSI oscillator helps gauge the magnitude and persistence of price movements, identifying overbought or oversold conditions. In contrast, the EMA emphasizes more recent price data by giving them more weight, allowing quicker responsiveness to price changes. The half-trend indicator offers a comprehensive view of potential trend directions and reversals by fusing these two metrics.
- Basis on Moving Averages:
- The half-trend indicator derives its foundation from the moving average Principle, reflecting average asset prices over a designated period.
- RSI Oscillator Inclusion:
- Measures the speed and change of price movements.
- Helpful in identifying overbought or oversold conditions, indicating potential reversals.
- Utilization of EMA:
- Places more significant emphasis on recent price data.
- Allows the indicator to be more reactive to new price information.
- Synergistic Functioning:
- By merging the insights from RSI and EMA, the half-trend indicator provides traders with robust signals about market trends and potential entry or exit points.
Half Trend Indicator Settings
Half trend indicator settings enable you to set amplitude, channel deviation, visual representations such as colors, object size, and visible and non-visible indicator parts. However, this indicator is automated, and you can not change moving average values.
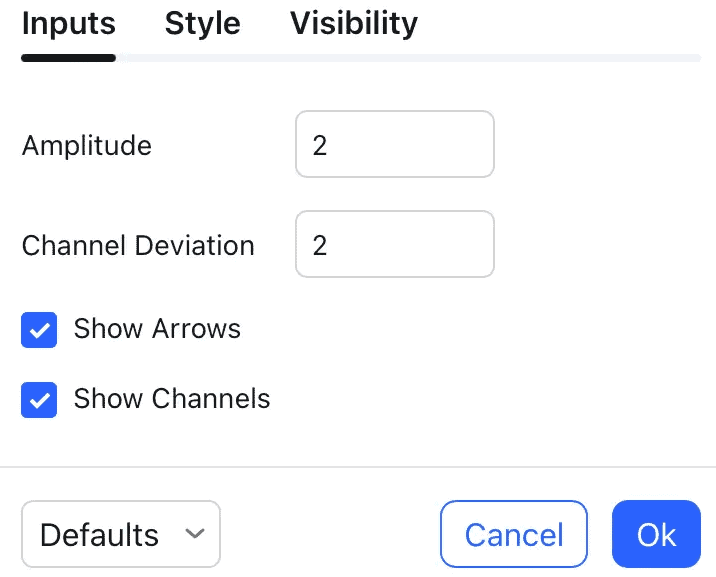
The “Amplitude” in an indicator’s settings refers to the indicator’s sensitivity to its internal variables, particularly price movements. Essentially, it dictates how responsive the line is to price changes.
- Degree of Consideration: A higher amplitude means the indicator is less sensitive to minor price fluctuations, and as a result, it will smooth out the line, capturing only more significant price moves.
- Trade Frequency: With a higher amplitude value, the indicator will generate fewer trading signals. It filters out minor price fluctuations, focusing only on more pronounced trends or reversals.
- Default Value: An amplitude of 2 is typically the default setting. This value balances responsiveness to price changes and filtering out market “noise.”
In summary, adjusting the amplitude allows traders to tailor the indicator’s sensitivity to their trading style. A trader who wishes to avoid frequent, potentially false signals might opt for a higher amplitude, while one who wants to capture every minor price movement might choose a lower setting.
This indicator indicates the precise signals with the help of moving averages. It is a live trend-following indicator that can be used by forex traders as and when required in any time frame to trade intraday efficiently. This trade is considered the absolute best because it is a non-repainting signal.
Moreover, it also defines the strength of the trend. If there is no trend, the indicator will be flat. However, if a trend exists, there will be a slope in that direction. If the slope is steep, the trend is strong. If there is a strong uptrend, the indicator will be blue, and the slope will be upward and robust. If there is a downtrend, the indicator will be red with a downward slope.
Advantages of the Half-Trend Indicator
- User-Friendly: The design of the half-trend indicator is straightforward, making it visually appealing and easy to understand, even for beginners.
- Beginner-Friendly: It presents information in a manner that’s digestible for novice traders, aiding their learning curve.
- Entry Point Clarity: The indicator provides clear signals regarding potential trade entry points, enhancing decision-making.
- Exit Strategy Guidance: Beyond just entry, the half-trend indicator also offers insights into when it might be optimal to exit a trade.
- Market Reversal Insights: It aids in detecting potential market reversals, crucial information for trend traders.
- Sentiment Analysis: The tool helps distinguish between bullish and bearish sentiments in the market, offering traders a mood gauge.
Disadvantages of the Half-Trend Indicator
- Lagging Nature: As a real-time indicator, it can sometimes lag, so it might not always capture sudden market moves instantly.
- Missed Opportunities: Due to its lagging nature, traders may sometimes miss out on potentially profitable trades.
- Limited for Advanced Traders: Seasoned traders might find the half-trend indicator too introductory for their sophisticated strategies and might not rely on it solely.
- False Reversal Predictions: The indicator can occasionally predict reversals that don’t materialize, potentially leading traders astray.
- Potential for False Signals: Like many indicators, there’s a risk of generating false signals, which can misguide traders.
- Dependency on Other Tools: The half-trend indicator often needs to be used with other technical tools for a more accurate and reliable analysis.
How do you trade with half trend buy sell MT4 indicator?
In a EURJPY H1 chart, the price will exceed the buy trend indicator. It should also be blue. This blue arrow signal should be below the indicator.
On the other hand, the price will be below the indicator for the selling scenario. Therefore, the color will be red, showing the sell signal.
Once this entry is validated, the trader should sustain the position and ride the trend until they exit on the opposing signal. For buying intents, a trader can also place a stop loss signal for a past swing low. The stop loss signal should be placed above the last high for the sell signal.
This indicator has a simple interface of entry and exit signals that tell about the robust nature of a trend. Experience and intermediate traders, including swing and intraday traders, can benefit from this. It is also free to download.
The bottom line
Half trend “Buy” and “Sell” MT4 indicator gives all essential details about forex trend trading. The entry and exit signals amalgamate to define the strength of a movement. Moreover, this MT4 indicator is free, does not repaint signals, and is reliable.
The half-trend indicator is a valuable tool in technical analysis, built upon the foundational concept of moving averages and enhanced with components like the RSI oscillator and EMA. Adjusting settings like amplitude can help traders customize the indicator’s sensitivity, optimizing its utility for their specific trading approach.

He is an expert in financial niche, long-term trading, and weekly technical levels.
The primary field of Igor's research is the application of machine learning in algorithmic trading.
Education: Computer Engineering and Ph.D. in machine learning.
Igor regularly publishes trading-related videos on the Fxigor Youtube channel.
To contact Igor write on:
igor@forex.in.rs
