The Awesome Oscillator (AO) is a technical indicator developed by Bill Williams to determine the market’s momentum. It measures the difference between the 5-period and 34-period simple moving averages (SMA) of the median price. The median price is the average high and low prices for a given period.
The Awesome Oscillator is typically visualized as a histogram, where positive values suggest bullish momentum and negative values suggest bearish momentum.
The awesome Oscillator is a histogram trading indicator that compares the current 5 bars with the 34 bars of the broader trends. The Awesome Oscillator is created to detect the bearish or bullish trend.


Awesome oscillator mt4 download


The Awesome Oscillator formula measures the difference between a 5-period and a 34-period simple moving average of the median price (the average of the high and low for a period). It’s visualized as a histogram, where values above and below zero indicate bullish and bearish momentum, respectively.
Median Price: (High+Low)/2

Awesome Oscillator = SMA (median price of 5-period) – SMA (median price of 34-period), where SMA stands for Simple Moving Average.
- Calculate the Median Price for each period: Median Price = (High + Low) / 2 Where:
- High = Highest price for the period.
- Low = Lowest price for the period.
- Calculate the 5-period Simple Moving Average of the Median Price: SMA5 = Sum of Median Prices over the last five periods / 5
- Calculate the 34-period Simple Moving Average of the Median Price: SMA34 = Sum of Median Prices over the last 34 periods / 34
- Compute the Awesome Oscillator (AO) value: AO = SMA5 – SMA34
Once you have the AO values, plot them as a histogram. The histogram will oscillate around a zero line:
- When AO is above zero: This suggests that the short-term momentum is more significant than the long-term momentum, which can be interpreted as a bullish scenario.
- When AO is below zero: This suggests that the short-term momentum is less than the long-term momentum, indicating a bearish scenario.
The Awesome Oscillator Interpretations and Signals
- Zero Line Crossovers: A cross above the zero line can be seen as a buy signal, and a cross below as a sell signal.
- Peak/Trough Analysis: The peaks and troughs of the AO histogram can be used to determine potential shifts in momentum.
- Twin Peaks: This is a bullish signal when two peaks are below the zero line and the second peak is higher than the first, followed by a histogram bar above zero. Conversely, it’s bearish when two peaks are above the zero line; the second peak is lower than the first, followed by a histogram bar below zero.
- Saucer: A bullish saucer is when the AO is above zero, and there’s a change from negative to positive values. A bearish saucer is when the AO is below zero, and there’s a change from positive to negative values.
Imagine you’re analyzing a stock’s price using the Awesome Oscillator (AO). One day, the AO histogram moves from a negative value to a positive one, crossing the zero line. This is seen as a potential buy signal, suggesting the momentum is turning bullish. Over time, you notice the AO forms a peak and then a trough, hinting at a momentum shift.
If the trough is higher than the previous trough, it might indicate a strengthening momentum. A few weeks later, two peaks form below the zero line. The second peak is higher than the first, and soon after, a histogram bar appears above zero. This is a bullish twin peaks signal, suggesting a potential upward price movement.
On the other hand, if two peaks had formed above the zero line and the second was lower than the first, followed by a bar below zero, it would indicate a bearish scenario. Later, when the AO is already in positive territory, you observe a slight dip into the negative and a quick return to the positive. This formation resembles a saucer and can be considered a bullish signal. Conversely, if the AO were negative and there was a brief rise to the positive before dipping back to negative values, that would be a bearish saucer, hinting at a possible price decline.
The Awesome Oscillator is an extension of Bill Williams’ other invention, the Alligator. The MACD mechanism is considered the base mechanism used to develop the AO. Several changes were made to the mechanism to ensure the AO doesn’t lag in areas where the indicators fall short. Market indicators tell us about the market sentiment, but the oscillators give us confirmed trends. They are also adept at predicting possible movements and impulses.
To see the exact change, the 34-period SMA is reduced from the 5-period SMA. The AO is different than market indicators in many ways. Indicators use closing prices to calculate the moving averages, while the AO focuses on the bars’ midpoint, for the same purpose: the arithmetic averages.
In the AO, the periods are set by its creator and cannot be changed. This is one of its most unique features. In CFDs and Forex, the AO is combined with other indicators and oscillators to derive more accurate results.
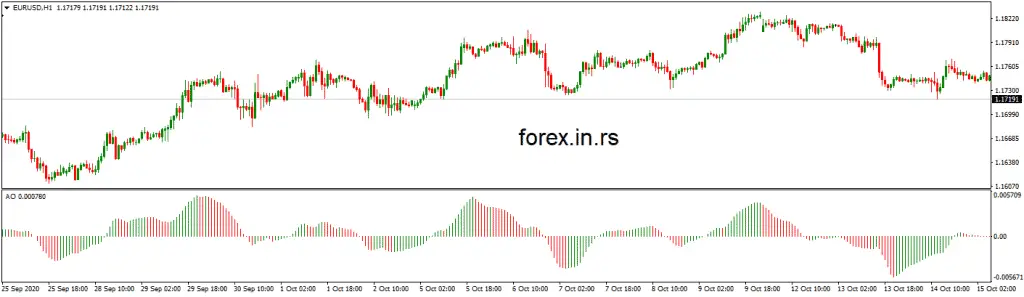
Awesome Oscillator Histogram
The AO is represented as a histogram with green and red bars as its default setting. It is easy to understand. If the bar is red, it is lower than the previous one, but it is on the higher side if it is green. The divergences lie between the 5-period and the 34-period averages.
The 5-period MA can lie on any side of the 34-period MA. Based on the 5-period MA, the bars are built by the oscillators above or below the zero level. The value of the AO will be positive if the bars are above the zero line but negative if they are below it. The divergencies in the moving averages are directly proportional to the trends. There will be an increase in the divergencies if the trends are increasing. This will result in the stretching of the oscillator bars. They will move up with bullish trends and down with bearish trends.
Conclusion
Many traders prefer the AO, but it can show you half a picture and be misinterpreted if used alone. Its creator fixes this Oscillator’s parameters, and you can only change the color of the bars. It has many useful functions and is easy to understand. We would suggest you use it in combination with other reliable indicators and oscillators.

He is an expert in financial niche, long-term trading, and weekly technical levels.
The primary field of Igor's research is the application of machine learning in algorithmic trading.
Education: Computer Engineering and Ph.D. in machine learning.
Igor regularly publishes trading-related videos on the Fxigor Youtube channel.
To contact Igor write on:
igor@forex.in.rs
