Table of Contents
In the realm of trading, while line and candlestick charts are the most commonly known, a variety of other chart types offer unique perspectives on market data. These alternative charts incorporate different dimensions of information, providing traders with a more holistic view of market activity. Beyond the ubiquitous line and candlestick representations, tools like footprint charts, point and figure charts, and Renko charts, among others, are gaining traction. Each of these charts offers distinctive advantages and insights, catering to the specific analytical needs of traders.
What are Footprint charts?
Footprint charts enhance traditional candlestick charts by incorporating additional data like trade volume and order flow, giving traders a more comprehensive view of market dynamics. These charts come in various formats, including footprint profile, bid/ask footprint, delta footprint, and volume footprint, allowing for deeper analysis beyond price movement.


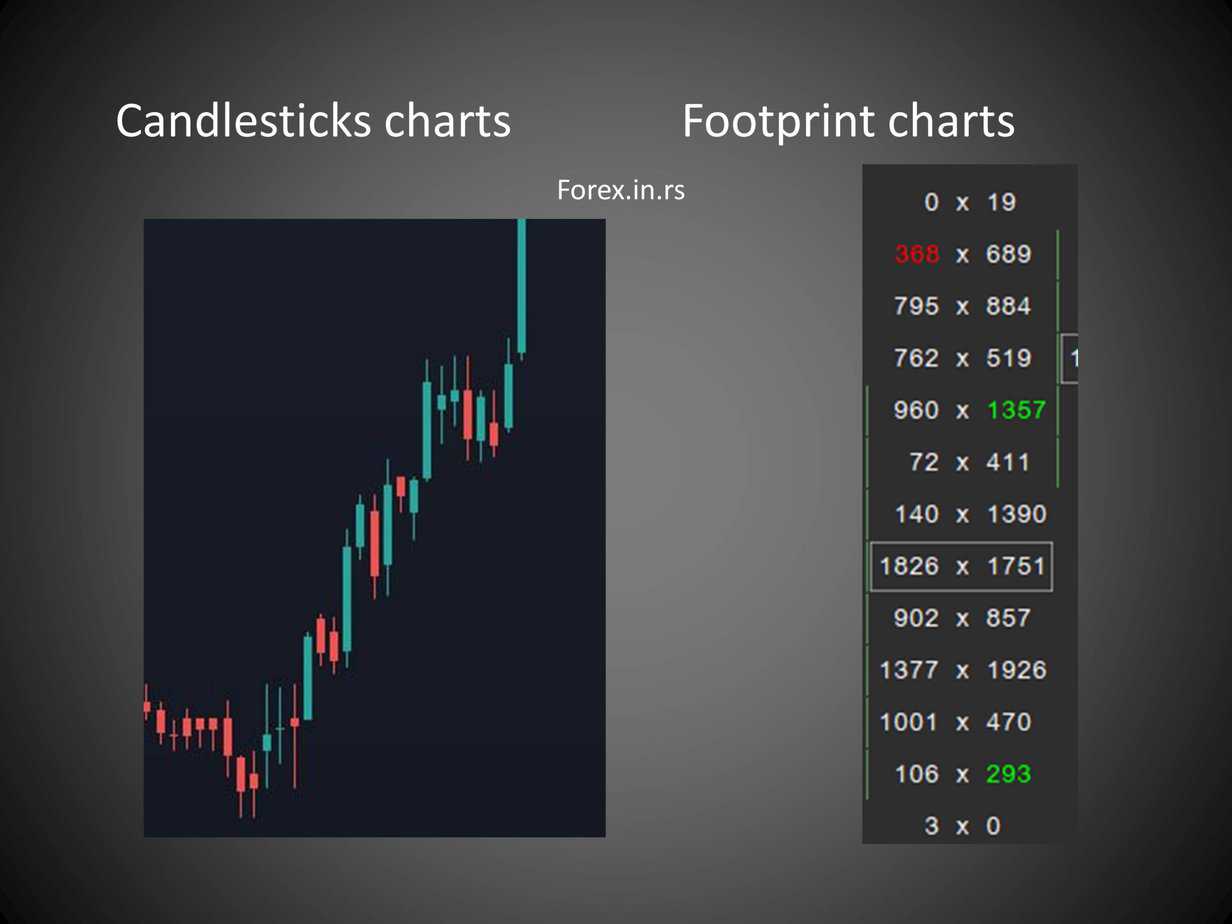


Footprint charts enhance the traditional candlestick format by integrating multiple market variables like volume, bid-ask spreads, and liquidity, enabling traders to tailor the chart to their specific analytical interests.
Alongside regular candlestick time-frames, footprint charts can be adjusted for short to long-term analysis and are often paired with other advanced tools like level 2 quote charts or DOM charts. Popular software like MarketDelta offers these charts via subscription, linking with significant brokerages for trade automation and providing customizable data feed options.
The footprint profile displays volume at each price level using a vertical histogram alongside regular footprint bars, helping traders identify where liquidity concentrates. The bid/ask footprint colors real-time volume for a more apparent distinction between buying and selling activities, revealing which group drives price shifts. Delta footprint highlights the net volume difference between buyers and sellers at specific prices, aiding in trend validation, while the volume footprint segments volume by both time and price, assisting traders in pinpointing capitulation points.
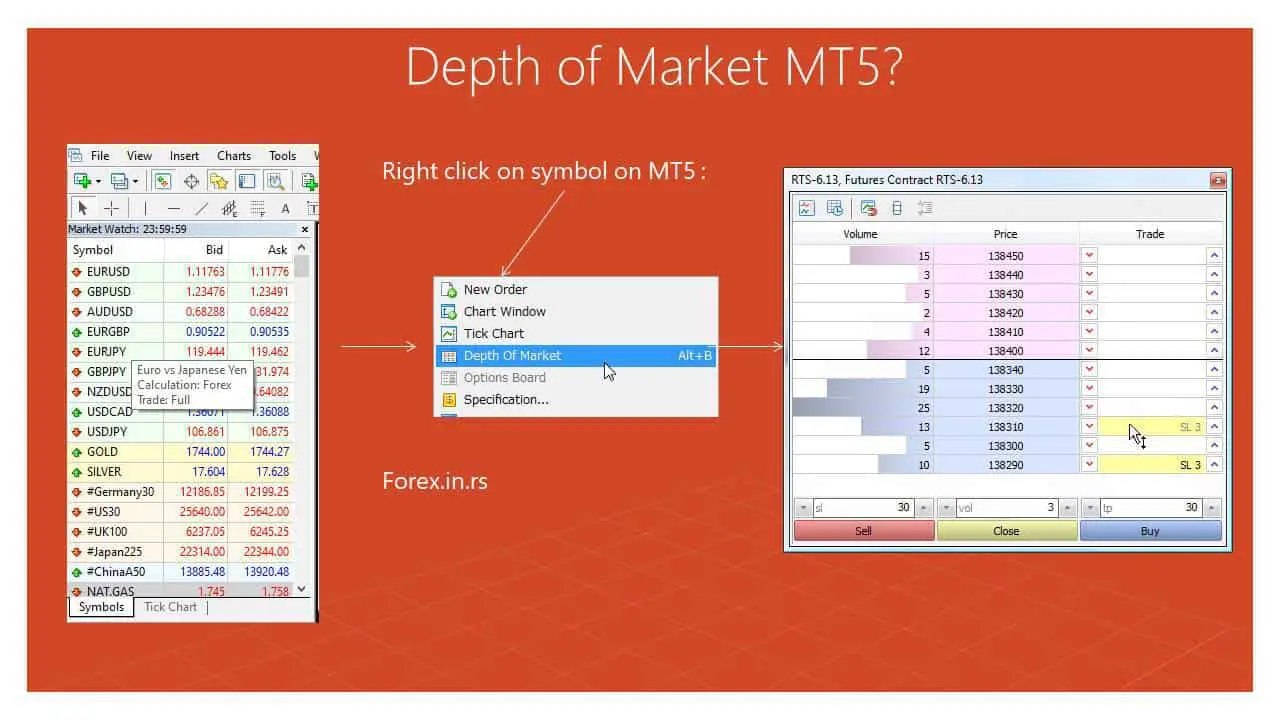
Does MetaTrader 4 Have Footprint Charts?
No, MetaTrader 4 does not have footprint charts because CFD brokers do not have information on volume, genuine buyers, and sellers in the forex market. Even the MT5 platform has depth-of-market and partial order-book capabilities that can not provide accurate trading volume in the forex market.

Footprint charts in MetaTrader face a significant limitation due to the absence of actual trading volume values. In the Forex market, it’s inherently challenging to determine the exact number of buyers, sellers, or the specific number of contracts being traded. Unlike the stock market, where the volume represents the actual number of contracts or shares traded, the Forex market’s volume in MetaTrader is deduced from the tick price movement.
This method does not provide an accurate representation as it does in stocks, where every traded contract is accounted for. Consequently, traders relying on the MetaTrader platform may not get a genuine picture of the market’s depth and liquidity through footprint charts. This discrepancy can lead to potential misinterpretations of market dynamics. Thus, while footprint charts offer many advantages, their application in MetaTrader for Forex trading needs to be approached with this limitation in mind.
Basic Information about Footprint Charts
The “P” pattern resembles the Latin letter “P” and features a narrow body at the bottom and a vast body at the top of a rising candlestick without significant shadows. This pattern suggests sellers are liquidating their positions and is most significant, following a downward trend. However, its appearance during sideways or upward price movements makes it irrelevant. Conversely, the “B” pattern, resembling the letter “B,” showcases a narrow top and broad bottom on a declining candlestick. It signifies that buyers are closing out, especially noteworthy after an uptrend, hinting at the potential end of that movement.
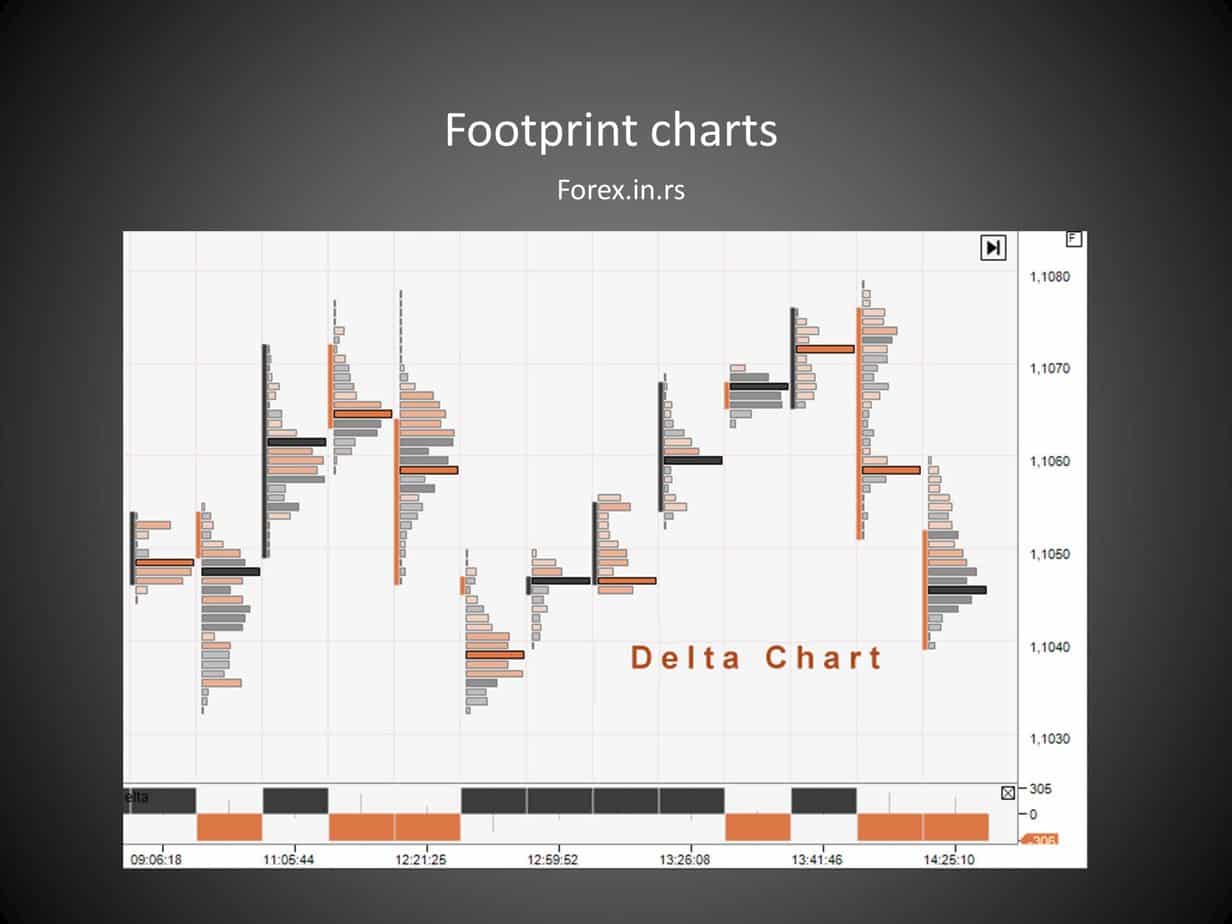
The Delta Chart is a valuable Forex tool distinct from traditional Japanese candlesticks, which can distort market perspectives during low volatility periods. In this context, Delta represents the difference between the number of market Buy and Sell orders, functioning as an indicator unrelated to traditional technical analysis. The Delta Chart is plotted based on this difference; for instance, a change of 300 contracts between Buy and Sell orders could create a new candlestick. This chart type excels in filtering out market noise, especially during periods of low trading activity. A unique characteristic of the Delta Chart is the “Signal” footprint pattern, guiding trade decisions.
MT4 and MT5 indicators for Footprint Charts
Footprint charts for MetaTrader, while visually appealing, unfortunately, lack the essential depth and granularity of data required for informed trading. They might replicate the aesthetics of footprint charts used in other platforms but miss out on capturing the true essence, primarily the actual volume. An accurate representation of volume in the Forex market, detailing the number of contracts or specific buyer and seller counts, is invaluable. MetaTrader’s footprint charts fall short here, relying instead on superficial volume metrics derived from tick price movements.
This discrepancy means traders aren’t getting a true reflection of market dynamics, which is crucial for decision-making. Promoting or writing about such a tool without highlighting these limitations could misguide traders. Hence, it’s essential to approach these charts cautiously and be transparent about their shortcomings, which is why I refrain from promoting them.
A programmer (my friend) developed a Footprint chart for the MT4 and MT5 platforms to bring the chart’s capabilities to these widely used trading platforms. However, the primary flaw was that these charts’ volume data were derived from the standard volume indicator available on MetaTrader. This means the “volume” represented lacked accurate, valid transactional data, which is crucial for genuine footprint chart analysis. Instead of providing actual market depth and liquidity insights, the charts offered merely an aesthetic representation. As a result, while they might appear sophisticated, they fall short in delivering actionable insights based on genuine volume data.
However, I will tell you what I told him: all information in that indicator is not valuable!
Conclusion
Our discussion shows that while MetaTrader 4 and 5 are popular trading platforms, they lack genuine footprint chart capabilities. MT4, in particular, does not incorporate footprint charts, a limitation stemming from the fact that CFD brokers don’t possess accurate volume data or specifics on genuine buyers and sellers in the forex market.
Despite MT5’s enhanced features, such as depth-of-market and partial order-book functionalities, it still falls short of accurately representing trading volume in the forex domain. Consequently, traders relying on these platforms might miss out on the more profound insights footprint charts offer in other contexts. Traders must understand these limitations when making decisions based on chart analysis in MetaTrader platforms. As always, having accurate and comprehensive data is paramount in the ever-evolving world of forex trading.

He is an expert in financial niche, long-term trading, and weekly technical levels.
The primary field of Igor's research is the application of machine learning in algorithmic trading.
Education: Computer Engineering and Ph.D. in machine learning.
Igor regularly publishes trading-related videos on the Fxigor Youtube channel.
To contact Igor write on:
igor@forex.in.rs
