Table of Contents
Traders, by nature, are drawn to clear, concise, and visually appealing representations of complex market data. An aesthetically pleasing trading platform enhances user experience and simplifies intricate price patterns, making decision-making more intuitive.
The clarity and beauty of a well-designed chart can significantly reduce cognitive load, allowing traders to focus on strategy and execution. Two such visually distinct and trend-highlighting methods are Renko and Heiken Ashi. Both offer unique perspectives on price movement, helping traders discern market direction with a blend of simplicity and elegance.


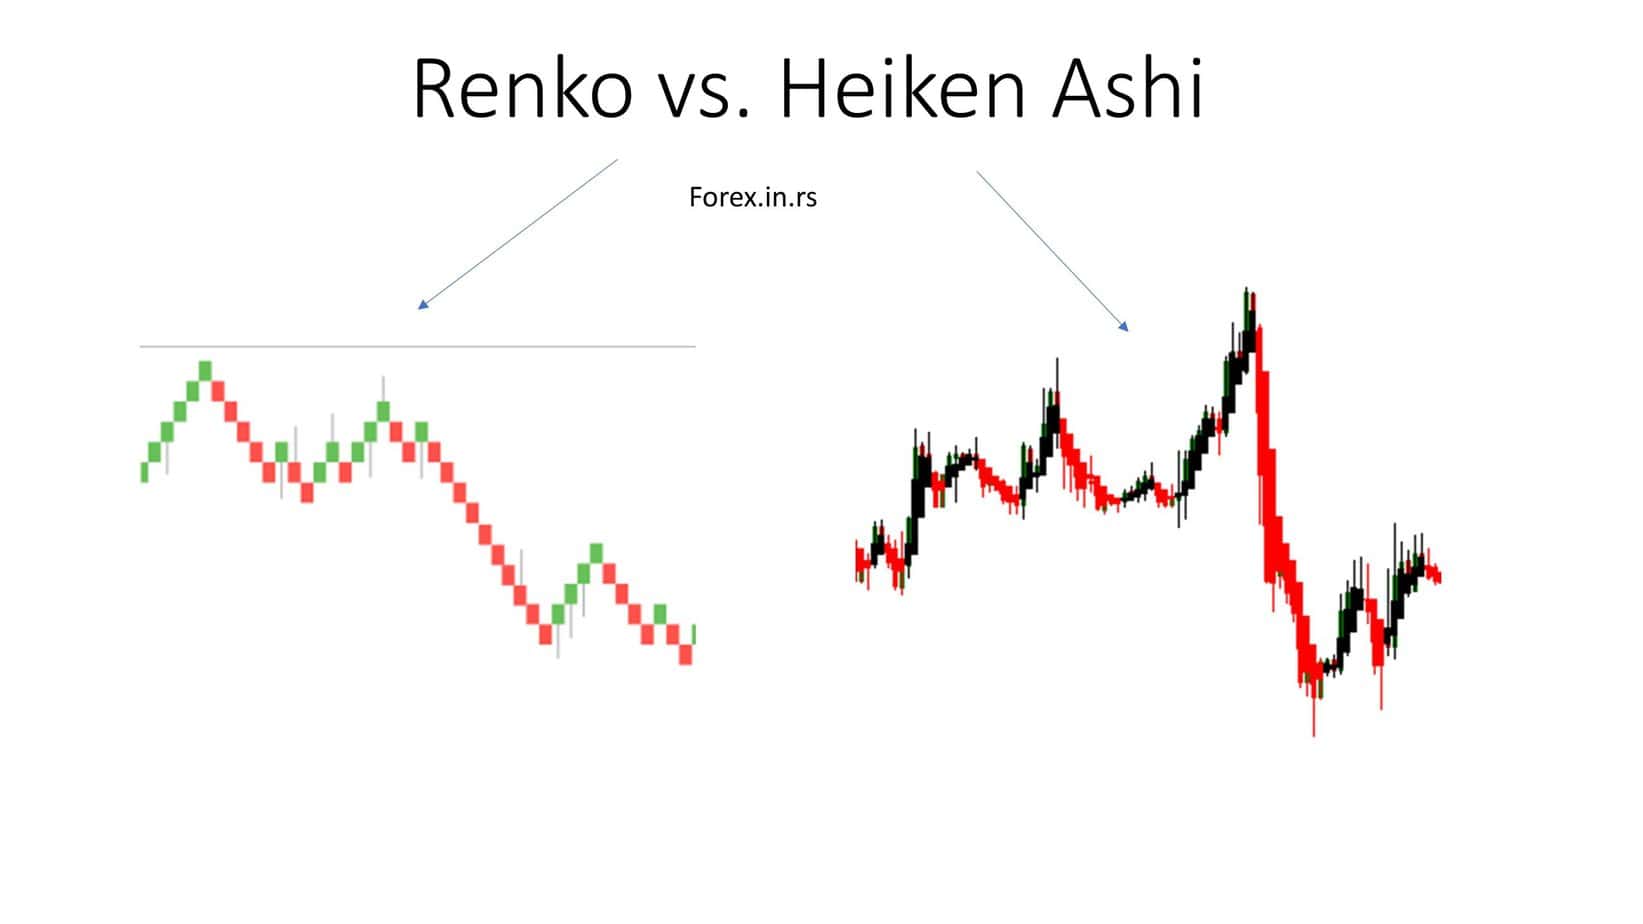
Renko vs. Heiken Ashi
Heikin Ashi charts utilize the open, high, low, and close averages from current and previous periods to create candles, whereas Renko charts form bricks based on a fixed price movement. Heikin Ashi’s variable candle sizes reflect averaged prices, whereas Renko’s uniform bricks indicate set price changes.


Renko:
- Brick Formation:
- It uses fixed price movements to create bricks.
- No regard to time; bricks form only when the price moves a predetermined amount (box size).
- Visualization:
- Excellent for highlighting pure price trends by eliminating minor price fluctuations.
- Box Size:
- It can be a fixed amount or dynamic based on metrics like Average True Range (ATR).
- Time Axis:
- Present, but not uniform. Bricks might take different time durations to form depending on price movement.
- Noise Reduction:
- Effectively filters out market noise by focusing on significant price changes.
Heiken Ashi:
- Candle Formation:
- It uses averaged price data from the current and previous periods.
- Visualization:
- Smoothens out price data, providing a clearer view of market trends than standard candlestick charts.
- Calculation:
- Average of the open, high, low, and close for the current and prior period.
- Time Axis:
- Uniform, as it follows the traditional candlestick charting approach.
- Trend Identification:
- It helps spot trends and potential reversals with its distinctive candle coloring and structure.
In essence, while both Renko and Heiken Ashi aim to provide a more precise visualization of market trends, they employ different methods and calculations, with Renko focusing on fixed price changes and Heiken Ashi on averaged price data.

Let us see practical examples:
Renko Charts
Renko charts are a type of price chart that displays price movements using bricks at 45-degree angles, where consecutive bricks don’t occur side by side. The size of each brick called the box size, can be a fixed price or determined by the Average True Range (ATR). While Renko charts do have a time axis, the time scale isn’t constant since bricks form based on price movement, not a fixed time interval. By focusing solely on significant price changes (typically using closing prices of the chosen time frame) and filtering out smaller movements, Renko charts reduce market noise and highlight clear trends for traders.
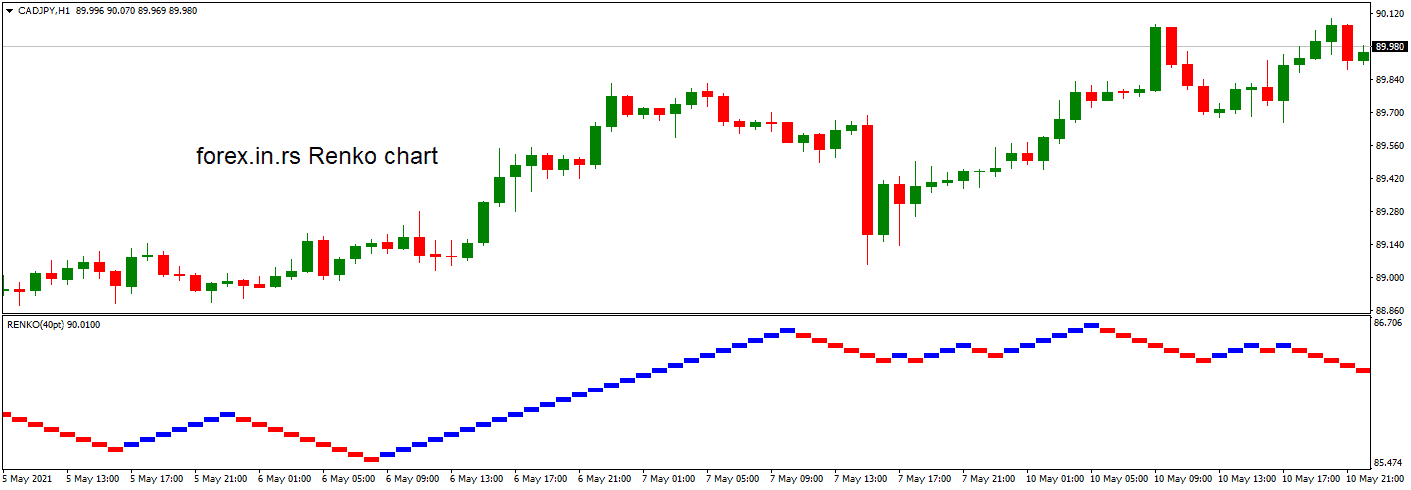
Let us see one example from the image above:
Using the CADJPY as an example with Renko charts: Imagine CADJPY is depicted on a Renko chart with a box size equivalent to 20 pips. Bricks are plotted based on closing prices, meaning intraday fluctuations or movements smaller than 20 pips are disregarded. The chart shows a pronounced uptrend characterized by a series of green bricks. Despite a brief period of decline indicated by red bricks, green bricks soon reappeared. This pattern suggests a solid uptrend, presenting an opportunity to go long on CADJPY. A good strategy might be waiting for a subsequent red brick before exiting the extended position.
Subsequently, the Renko chart shows a sharp downtrend with a string of red bricks. To capitalize on this, traders might await a minor pullback, represented by a green brick. Once a red brick reappears after the pullback, it could be a signal to initiate a short position, anticipating that the CADJPY might continue its downward trajectory in line with the overarching downtrend. The appearance of a green brick later might be an indication to close the short position.
Heiken Ashi
Heiken Ashi charts are a Japanese charting technique emphasizing the visualization of price trends. Instead of traditional candlestick patterns, Heiken Ashi forms candles using averaged price data from the current and previous periods.
First, let us present the Heiken Ashi chart:
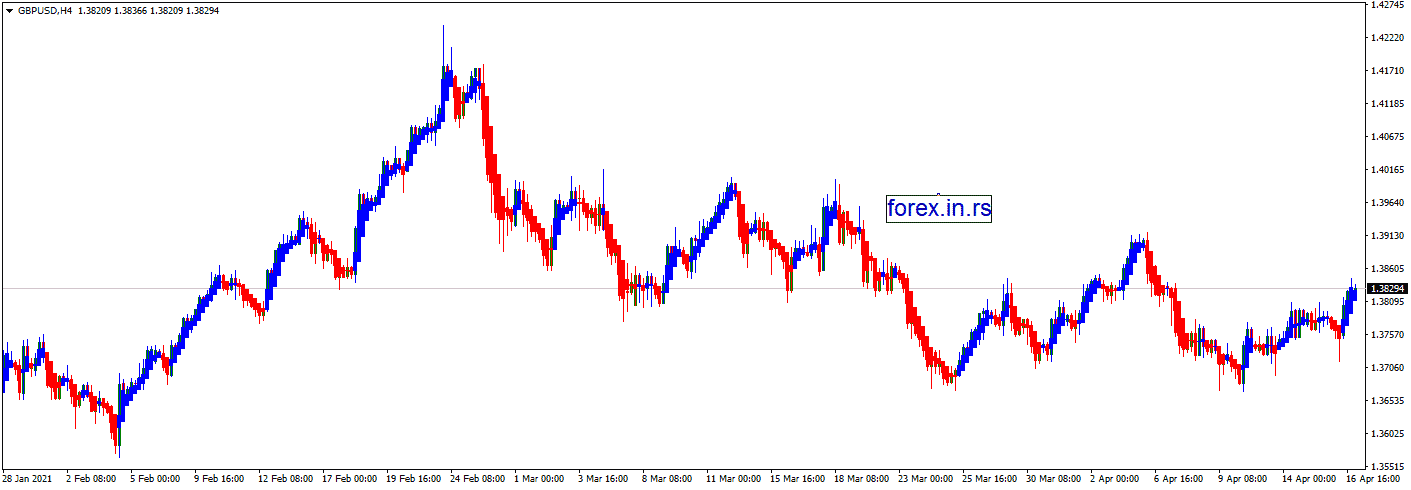
Set the chart to display the H4 (4-hour) timeframe. Most trading platforms offer the option to apply the Heiken Ashi candlestick type, so you’d apply that to your chart. Once this is set up, you can use the Heiken Ashi candles for trend identification. Candles that are green and lack lower shadows typically indicate strong buying momentum. If you notice a series of such candles, it suggests a potential bullish trend.
Conversely, red candles without upper shadows often signify intense selling pressure, hinting at a possible bearish trend. To optimize your trading strategy, you could consider combining Heiken Ashi with other technical indicators like moving averages or RSI for additional confirmation of the trend and potential entry or exit signals.
Specifically, each candle’s open is derived from the midpoint of the previous candle, and its close is the average of the current period’s open, high, low, and close. By doing so, Heiken Ashi smoothens out price volatility, making it easier to identify sustained trends. As a result, this method offers a clearer perspective on market momentum and potential trend reversals compared to standard candlestick charts.
To calculate the Heikin-Ashi candles:
- Heikin-Ashi Close (HAClose):
- Calculate by taking the average of the current period’s open, high, low, and close.
- HAClose = (Open + High + Low + Close) / 4
- Heikin-Ashi Open (HAOpen):
- Calculate the midpoint between the previous Heikin-Ashi candle’s open and close.
- HAOpen = (PreviousHAOpen + PreviousHAClose) / 2
- Heikin-Ashi High (HAHigh):
- Determine the highest value among the current period’s high, Heikin-Ashi open, or Heikin-Ashi close.
- HAHigh = Max(CurrentHigh, HAOpen, HAClose)
- Heikin-Ashi Low (HALow):
- Determine the lowest value among the current period’s low, Heikin-Ashi open, or Heikin-Ashi close.
- HALow = Min(CurrentLow, HAOpen, HAClose)
Combination of Renko and Heiken Ashi
Using Heiken Ashi and Renko together on a single chart may not be an optimal choice for several reasons, primarily because both methods are designed to highlight trends by smoothing out price data, albeit in different ways.
- Redundancy: Heiken Ashi and Renko aim to depict the prevailing trend by minimizing market noise. Using them together can be redundant as they could offer overlapping information, which doesn’t provide additional clarity or value to the trader.
- Potential for Confusion: The combined presentation of both methods might clutter the chart and introduce confusion. For instance, while Renko bricks are based on a fixed price movement, Heiken Ashi candles are averaged price data from the current and previous periods. These differing bases might conflict or mislead a trader when viewed simultaneously.
- Loss of Fine Details: Both methods individually filter out specific price data to present a smoother view. Combining them might compound this effect, potentially causing the trader to miss out on specific necessary price actions or signals.
- Complexity in Analysis: Analyzing one trend-filtering method already requires a certain mindset and set of rules. Combining two different trend-highlighting techniques can complicate the analysis process, making it harder to make quick and informed decisions.
- Reduction in Responsiveness: Renko and Heiken Ashi can lag actual price movements because of their smoothing nature. Using them in tandem might make the chart less responsive to real-time market changes, potentially delaying entry or exit signals.
Conclusion
Renko and Heiken Ashi are effective charting techniques highlighting market trends by filtering out minor price fluctuations. While Renko focuses on fixed price movements to create bricks irrespective of time, Heiken Ashi uses averaged price data from the current and previous periods to form its candles.
Using them together on one chart might introduce redundancy and potential confusion due to overlapping objectives. For clarity and practical trend analysis, traders should choose one method that aligns with their strategy and become adept at its interpretation.

He is an expert in financial niche, long-term trading, and weekly technical levels.
The primary field of Igor's research is the application of machine learning in algorithmic trading.
Education: Computer Engineering and Ph.D. in machine learning.
Igor regularly publishes trading-related videos on the Fxigor Youtube channel.
To contact Igor write on:
igor@forex.in.rs
