RSI filter indicator is created based on the Relative strength indicator.
What is the RSI filter indicator?
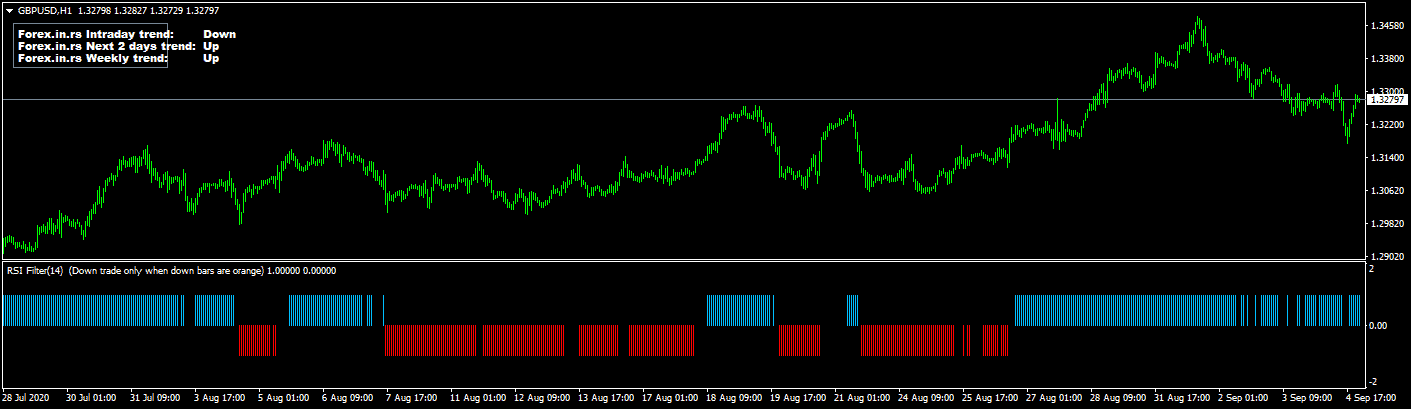
The RSI filter indicator represents the MT4 indicator that presents the chart’s upper, lower, and neutral trading area. Besides that, intraday and weekly trends are shown in the left corner.
The trends dashboard is added to this version of the RSI filter in the left-up corner.


Below you can search for free download indicators:
RSI filter indicator download


The RSI (Relative Strength Index) filter indicator is a technical analysis tool traders use to determine whether an asset is overbought or oversold and hence to predict future price changes. The RSI filter indicator extends the basic RSI and provides additional visual information to help traders make more informed decisions.
Here’s a more detailed breakdown:
- RSI filter indicator is a type of MetaTrader 4 (MT4) indicator. MT4 is a popular platform for trading Forex, analyzing financial markets, and using Expert Advisors.
- The basic RSI oscillates between zero and 100 and is typically used with a period of 14, which can be daily, weekly, or monthly price data. When RSI goes above 70, the asset is considered overbought; when it goes below 30, it is considered oversold.
- The RSI filter indicator provides additional layers of information beyond the basic RSI. For example, it visually represents upper, lower, and neutral trading areas on the chart. This can help traders easily identify the overall trend and potential reversal pointsy.
- In the left corner of the chart, the RSI filter indicator displays the intraday and weekly trends. This feature helps traders quickly gauge the market’s short-term and longer-term directional bias.
- Like all technical indicators, the RSI filter indicator should be used with other technical analysis tools and indicators to confirm signals and prevent false alarms. It’s not infallible and doesn’t guarantee success, but when used correctly, it can be a valuable tool in a trader’s arsenal.
RSI filter indicator levels
In the RSI filter indicator:
- UPPER: While there is a clear break above the level of 70, the state is assumed from the last or previous pole.
- LOWER: While there is a clear break below the level of 30, and the state is taken from the previous or previous pole.
- NEUTRAL: In this position, the price value is traveling between the value of 40 to 60.
You should also know these facts:

- The blue pole means an optimistic trend.
- The red bar represents a rough and clumsy trend.
- The blank sticks represent the balanced state of the market.
RSI filter indicator signals
Before proceeding, you should know about the fundamental trading signals. These are as follows:
- BUY SIGNAL: You need to go a long way while the vertical poles of the RSI filter get the color of deep shaded sky blue, and it will be placed above the zero signal level. The trend needs to be bullish in the dashboard.
- SELL SIGNAL: You need to go a short way while the vertical poles of the RSI filter get the shade of red color, and it will be placed beneath the zero signal level. The trend needs to be bearish in the dashboard.
- EXIT BUYING TRADE: At the optimistic trend, you need to buy all the orders. At that time, the RSI filter indicator shows the red vertical pole below the zero signal line level.
- EXIT SELLING TRADE: If you notice that the clumsy and rough trend is in progress, then you need to sell all the orders. The RSI filter indicator shows the deep sky blue shaded vertical pole above the zero signal line level.

He is an expert in financial niche, long-term trading, and weekly technical levels.
The primary field of Igor's research is the application of machine learning in algorithmic trading.
Education: Computer Engineering and Ph.D. in machine learning.
Igor regularly publishes trading-related videos on the Fxigor Youtube channel.
To contact Igor write on:
igor@forex.in.rs
Related posts:
- MBFX Timing Indicator – Free download MT4 Indicator
- FX Vortex Indicator Free Download
- Free Download True Strength Index TSI Indicator
- Trend Dashboard Indicator MT4 Download – Forex Dashboard Free Download
- Vertex Mod Indicator – Free Download Vertex Mod No Repaint Indicator
- Forex Chart Pattern Indicator Free Download
- Free Download Power Trend Indicator MT4
- Download Free Hawkeye Volume MT4 Indicator! – How to read Hawkeye volume indicator?
- Download Half Trend Indicator MT4
- Choppiness Index Indicator For MT4 Download Free!
- Super Scalper Indicator Free Download
- Download Buy Sell Magic Indicator MT4
