Table of Contents
The EMA Indicator is a fantastic market trend indicator. This forex indicator is perfect for predicting the direction of the trend and following price activity across many pairs. The most effective instruments for forex investors are moving averages (MA). They show how prices have changed throughout time.
It’s noteworthy to mention that the EMA is one of four forms of MA. EMA gives current prices more weight. This indicates that it responds better to recent market fluctuations than simple MA. Furthermore, the EMA MT4 indicator-free download can detect price shifts promptly. On the other hand, it goes through more changes in a shorter period.


What is EMA Indicator?
EMA indicator represents an exponential moving average line on the chart that tracks an asset’s price over time. This indicator places a more significant weight (exponential weighted moving average impact) and significance on the most recent price data points.


What indicator to use for EMA crossover in MT4?
The best crossover EMA periods are 10, 20, 50, 100, and 200. So, for example, to make an excellent EMA crossover, you can choose EMA 50 and EMA 200 crossover.
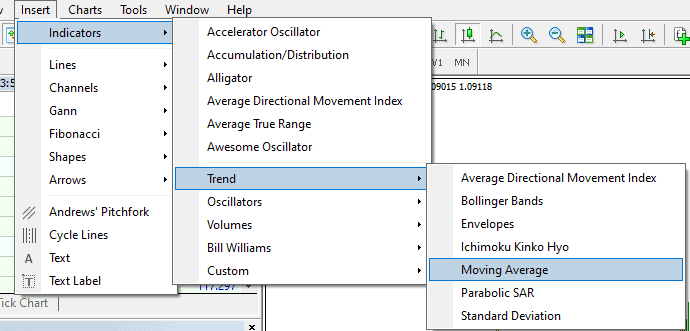
To plot the EMA indicator on the chart, you need to use MA (Moving Average indicator). In MT4, you need to go to “Insert,” then to “Indicators,” choose “Trend,” and press the “Moving average” option. Finally, set wished Period and choose from the list instead of SMA, choose EMA as the MA method.

How to understand EMA indicators?
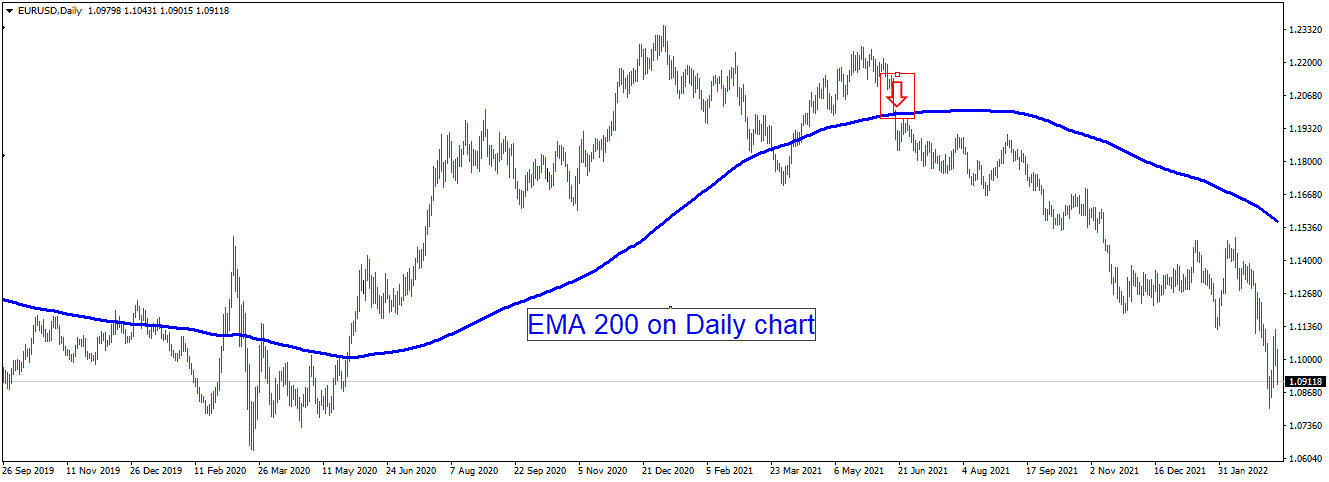
EMA indicator you need to understand as classical trend indicator where above EMA line is a bullish trend and below EMA line is a bearish trend. So, for example, if the price is above EMA200 on the daily chart, we can tell that the daily trend is bullish, and usually, this indicator has a high impact on technical analysis.
How to read EMA indicator in crypto?
We need to understand the EMA indicator on the crypto-asset chart as a trend trading indicator. For example, if the price is above EMA200 on the daily chart, we can tell that the daily trend is bullish, and usually, this indicator has a high impact on technical analysis.
Using the Exponential Moving Average Indicator in Trading
The EMA – Exponential Moving Average indicator can be used in various ways. An increasing EMA usually implies a bullish trade, while a dropping EMA indicates a bearish market action. This explains that you should hold onto the positions when there is an increase in the EMA. However, when there is a decrease in EMA, you should sell the trades.
To understand the overall market trend, you should also examine the EMA’s position. When the market price advances beyond the EMA indicator line, it shows that an uptrend is in progress. In the same way, there is a downtrend in the market when the market price is under the EMA indicator line.
Crossover technique
The Crossover technique gives better trade signals. This technique generally includes both up and down EMA periods, commonly nine and twenty-one EMA periods. A buying signal is formed when the lower EMA crosses the higher duration EMA underneath. Similarly, a sell signal is formed when the lower EMA traverses the higher EMA from the top.
Now, the question arises, what about the exit plan? First, you can consider keeping the EMA indicator at previous lower trade and profit during the following high trade or in the resistance zone.
Triple EMA technique
The indicator gives better results using triple EMA. For providing better signals, it combines three distinct periods. You could, for example, incorporate the five, fifteen, and two hundred EMA intervals. The price must be hovering beyond the two hundred EMA line for purchase signals. After that, hold on until the five-period EMA enters the fifteen-period EMA line.
Illustration in a chart
A five-period EMA is pointed by a grey-colored arrow represented by a blue-colored line. While the fifteen periods EMA is represented using a red-colored line, a green-colored line represents a two hundred period EMA.
Keep in mind that the trading price is beyond two hundred period EMA. Therefore, whenever the indicator generates the buy signal, it is shown by a yellow-colored circle; it shows that the five periods EMA has crossed the fifteen periods EMA; in simpler words, the blue-colored line has crossed the red-colored line. After this indication, the price continues to rise.
An ideal stop loss is situated below the previous low and immediately below the penetrating pattern. The 200 EMA, a long period EMA, serves as an excellent stop loss. Therefore, the 1:3 ratio of risk to return can be considered for the exit plan. The following area of resistance also serves as a strong profiting zone.
Conclusion
The EMA – Exponential Moving Average indicator can be considered a fantastic indicator. It’s worth noting that chart patterns become smoother over longer durations. Yet, it generates a more significant number of erroneous signals. While for brief durations, they generate additional signals but more misleading signals. As a result, it’s good to utilize the indicator by combining other techniques to acquire more accurate results.

He is an expert in financial niche, long-term trading, and weekly technical levels.
The primary field of Igor's research is the application of machine learning in algorithmic trading.
Education: Computer Engineering and Ph.D. in machine learning.
Igor regularly publishes trading-related videos on the Fxigor Youtube channel.
To contact Igor write on:
igor@forex.in.rs
