Table of Contents
What is the Donchian Channel indicator?
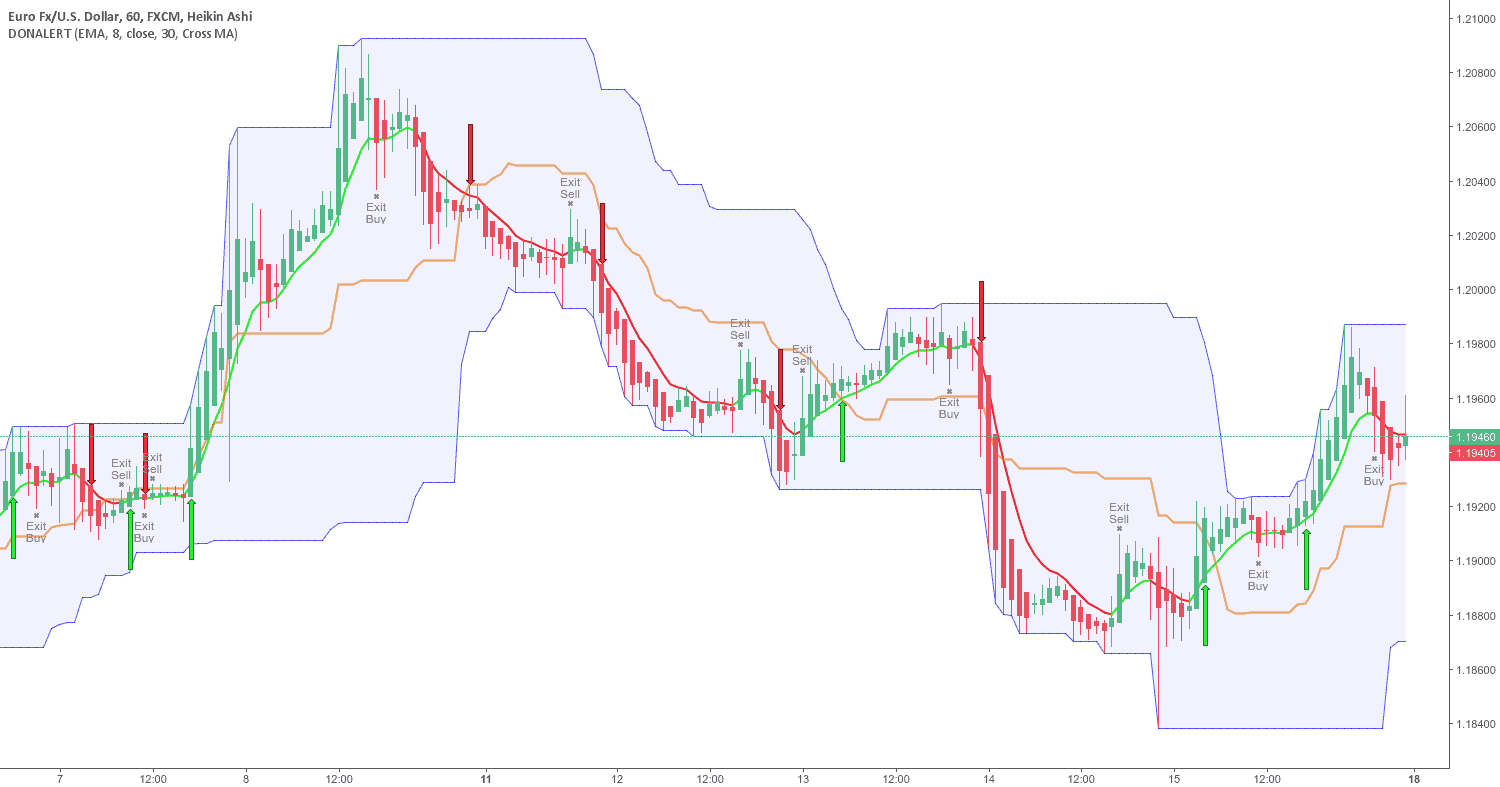
The Donchian channel is a market indicator created by Richard Donchian. It is based on calculating the lowest and highest high markets for the last nth periods. The channel is the area between low and high for the chosen period.
It is a common tool that is available on most trading platforms. It is depicted in a chart demonstrating the market price channel for high and low values. It is a productive tool for measuring the volatility of the market.


Free Download Donchian Channel Indicator


Explained in Detail
The Donchian channel has a default setting of a 20-day period, which the traders can adjust. Based on the default setting, it can be classified into three parts:
- The 20-day high, known as the upper band
- The average of the upper and the lower band, known as the middle band
- The 20-day low, known as the lower band
Looking at some of the Donchian channel examples, you will realize that it is not extremely tough to understand. If the Donchian channel indicator is narrow, the price is stable. It will be more expansive if there are a lot of fluctuations. It is primarily used for providing long and short forex position signals.
How to trade the Donchian channel for Maximum Benefits?
To begin with this part, you first need to understand with ‘R’ stands for. ‘R’ denotes the relationship between the risk that you are taking and the relative return. For example, if you are risking $20 and earning $1000, you have gained 5 times, denoted at 5R.
Understanding the Donchian channel might not be rocket science, but it does require your utmost attention. While any trader is bound to make a few mistakes while using it for the first time, here are some pro tips on how you can use this tool to maximize your profits:

- 2R open profits
It is necessary to create a safety buffer because you never know when the market might go against you and there is a pullback. If you trade without available profits, you may lose more than you had assumed earlier.
- Scale your winner concerning the pullback
The Donchian channel breakout can be used as an entry trigger. It would be unwise to risk 1R on your last trades as you will lose all available profits if the market pullbacks. You need to adjust, keeping in mind the risk factors involved. Go in with 0.5R instead so that you still have a good chance of making a more significant profit if there is a market movement in your favor but with reduced risk.
- Know when to exit
This applies to every trade and business. One must have an exit strategy. How will you exit from your position? Will you go both long and short positions simultaneously and restart again, or will you make a different strategy?
It would help if you decided on these things before starting a trade.
How to Customize the Donchian Channel for Better Trades?
The upper and lower band of the Donchian channel are the most versatile ones. You can adjust them, not the middle one, which shows the average of the other two. Use the extreme bands as trend filters to determine whether you should sell or buy.
This is how it is done:
- Define the long-term trends by adjusting the channel to a 200-period.
- There are buying opportunities if the prices rise above the middle band.
- There are selling opportunities if the prices fall below the middle band.
How to Use the Dochian Channel to Identify the Latest Trends?
If used properly, the Donchian channel can allow you to identify the massive trends in the market. These trends can keep you way ahead in the game. If you want to ride these gigantic trends, you should trail your stop loss.
What does this mean?
Trailing the stop loss means that you will stay engaged in the trade. You will neither have target profits nor will you second guess yourself. You cannot bail out because the situation doesn’t feel comfortable.
You will not abandon your trailing stop loss and exit when the channel signals that.
This is how the Donchian channel can help you by riding significant trends.
- Traders should use the lower band of 20-days (low) for trailing your stop loss if they wish to ride an uptrend.
- Traders should use the upper band of 20-days (high) for trailing your stop loss if they wish to ride a downtrend.
Whether you wish to ride the shorter or, the longer trends, you must adjust the Donchain channel settings. To ride a long-term trend, opt for a higher value, and for a short-term one, opt for a lower one.
The Donchian Channel and the Average True Range Combo
The Donchian channel and average proper range combo can allow traders to find highly profitable trades consistently. This is not a magical combo with guaranteed success, but it can help you predict when the market is expected to have an explosive breakout. Here’s how:
Step 1:
It would help if you studied multi-year low levels using the Average True Range indicator (ATR). It is a good sign if it is lower than the previous multi-year low.
Step 2:
It would help if you traded using the breakout of the Dochian channel forex. You go to an extended position when the price breaks above the upper band and a short position when the price breaks below the lower band. The upper band is a 20-week high, and the lower band is a 20-week low.
This is done because the market has a way of movement. It goes from low volatility to high volatility. The ATR indicators will detect low volatility periods, and the Donchian Channel will enable you to trade with the breakout and capture the move.
Mistakes to Avoid when Trading Using the Donchian Channel
As mentioned earlier, this channel does not translate into 100% success. It is a tool that can be profitable if used to ride. It can show you the trade opportunities and the current market trend, but it will not make the decisions on your behalf or freeze the market for you. Many traders blindly trade the bands and take everything at face value. They go short when they see the price is at the upper band. They assume that the market will reverse slowly as it is overbought. This is the first mistake that you can make. This is because it is an uptrend, and in such situations, the prices tend to remain in the upper band for a long time.
So what does this mean?
It means using the Donchian channel for its intended purpose; you should let it guide you regarding your entries and exits. It is not the right indicator to assess whether the market conditions and overbought or oversold.
FAQ
Veteran and regular traders are familiar with the terms of the Donchian channel and how it should be used. However, if you are a new trader, you must have a few questions. Let’s answer these:
Q1. Does the price break out in the Donchain channel? I can see the price touching the top or the bottom channels. The channel adjusts to the price changes afterward. This does not look like a breakout. Can you explain this?
A. Consider a situation in which you have set the channel for a 50-day high of the market. If the channel touches that upper blue line, the prices have broken out of the 50-day high. Similarly, if the prices feel the lower blue line, the prices have broken from the 50-day low.
Q2. Can you explain how the Bollinger Bands are different from the Donchian channel?
A. These two are very different tools. Bollinger Bands adjusts according to the market’s volatility, whereas the Donchian channel is about the market’s highs and lows. It plots the highs and the lows of the need for your set period.
Conclusion
The Donchian channel can help you understand the market’s highs and lows. This means you can quickly determine the current or upcoming trends and ride them to make profits. It is not meant to identify whether the market is overbought or not. You can look for price breakouts and make the trade based on your understanding. It is a marketing tool and not and handbook. This must be kept in mind at all times.

He is an expert in financial niche, long-term trading, and weekly technical levels.
The primary field of Igor's research is the application of machine learning in algorithmic trading.
Education: Computer Engineering and Ph.D. in machine learning.
Igor regularly publishes trading-related videos on the Fxigor Youtube channel.
To contact Igor write on:
igor@forex.in.rs
