Technical and fundamental analysis plays a crucial role in stock trading decisions. While fundamental analysis provides insights into a company’s intrinsic value and overall health, technical analysis focuses on price movements and historical patterns. Traders can predict potential price trends by analyzing charts, indicators, and volume and identify optimal entry and exit points. Incorporating both approaches offers a holistic view, enhancing the probability of successful trades.
How do you find stock entry and exit signals?
Entry stock signals are usually previous low or high price levels. To find stock entry and exit signals, traders must define several fundamental and technical triggers related to particular stocks. In the first step, traders must determine a stock’s natural or “fair market” value using fundamental stock indicators such as The Income Statement, balance sheet, Statement of Cash Flows, Price-to-Earnings Ratio, etc.


Next, suppose fundamental analysis allows buying or selling the stock. In that case, traders define price entry-level using previous support and resistance or significant price levels based on Fibonacci levels, Pivot Points,/trading indicator oscillators (RSI, MACD, Volatility), moving averages, etc. The previous critical price level is the best entry price level.


1. Fundamental Analysis for Stock Valuation:
- Income Statement: Assess the company’s revenue, profit margins, and net income. Look for consistent growth patterns and check for anomalies or one-time events that may have affected profitability.
- Balance Sheet: Assess the company’s assets, liabilities, and shareholder’s equity. A healthy company should have more assets than liabilities. The current ratio (current assets/liabilities) can provide insights into the company’s short-term liquidity.
- Statement of Cash Flows: This statement reveals the company’s cash inflows and outflows, helping to gauge the actual cash-generating ability of the business. Positive operating cash flow is a good sign.
- Price-to-Earnings (P/E) Ratio: This metric divides the stock price by its earnings per share. By comparing this to other companies in the same sector or its historical values, you can determine if the stock is overvalued or undervalued.
- Other Fundamental Indicators: Return on Equity (ROE), Debt-to-Equity ratio, Dividend history, etc., can provide additional insights into the company’s financial health.
- External Factors: Keep abreast of industry trends, economic indicators, and geopolitical events that might influence the stock’s performance.
2. Technical Analysis for Entry and Exit Points:
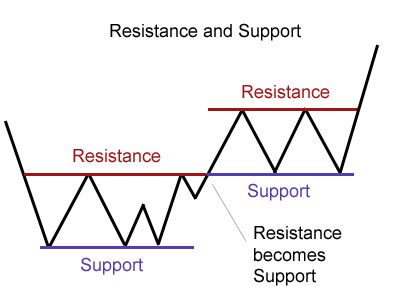
- Support and Resistance Levels: These are price levels at which a stock historically has trouble moving above (resistance) or below (support). They serve as potential entry or exit points. For example, buying near support levels and selling near resistance levels can be a strategy.
- Fibonacci Levels: These horizontal lines indicate potential support and resistance levels based on the Fibonacci sequence. They are instrumental in stocks with significant moves up or down.
- Pivot Points: Calculated using the high, low, and close of the previous trading day, traders use these as predictive indicators of price movement.
- Indicator Oscillators:
- RSI (Relative Strength Index): Values above 70 are considered overbought (potential sell signals), and values below 30 are considered oversold (potential buy signals).
- MACD (Moving Average Convergence Divergence): Buy signals are typically considered when the MACD line crosses above the signal line and vice versa for sell signals.
- Volatility Indicators: High volatility might indicate potential reversals.
- Moving Averages: The crossing of a short-term moving average over a long-term one (Golden Cross) can be bullish, while the opposite (Death Cross) can be a bearish sign.
- Chart Patterns: Patterns like head and shoulders, double tops/bottoms, triangles, and flags can provide potential entry and exit signals based on historical repetition.
Workflow for Trading Decision:
- Start with a fundamental analysis to determine if a stock is undervalued or overvalued.
- If the stock seems undervalued (for buying) or overvalued (for selling), move to technical analysis to find the optimal entry and exit points.
- Determine stop-loss points to manage risk, often at significant support or resistance levels.
Find Entry Signal for Apple – Practical Example
Fundamental Analysis:

- Income Statement: Over the last four quarters, Apple has shown a consistent 10% increase in revenue, suggesting growing demand for its products.
- Balance Sheet: Apple has a current ratio of 1.5, suggesting it can comfortably meet short-term liabilities.
- Statement of Cash Flows: Cash from operating activities has increased by 8%, indicating good cash-generating capability.
- Price-to-Earnings (P/E) Ratio: Apple’s P/E is currently 25, which, when compared to the sector average of 30, suggests it might be undervalued.
- Other Indicators: Apple announced the launch of a new innovative product, expected to drive sales further in the upcoming quarters.
Decision Based on Fundamental Analysis: The fundamental indicators suggest that Apple is in a healthy financial position and might be undervalued. Therefore, it could be an excellent stock to consider buying.
Technical Analysis:
- Support and Resistance: Apple stock has a strong support level at $140 and resistance at $160.
- Moving Averages: Apple’s 50-day moving average recently crossed above its 200-day moving average (Golden Cross), which is a bullish signal.
- RSI: The RSI is currently at 40, suggesting it is not overbought territory and has room to move upwards.
- MACD: The MACD line has crossed above the signal line, providing a bullish signal.
- Chart Patterns: Apple’s stock chart forms an ascending triangle pattern, typically a bullish continuation.
Decision-Based on Technical Analysis: The technical indicators suggest bullish momentum. Given the support at $140 and resistance at $160, there’s potential for an upward move.
Trade Setup for Apple Stock:
- Entry Position: Considering the combination of fundamental strength and bullish technical signals, consider buying Apple stock around its current price.
- Stop Loss: Set a stop loss slightly below the support level to protect against potential reversals. In this example, if the support is at $140, a stop loss could be set at $138.
- Target: Since the resistance is $160, it might be a potential target. However, considering the bullish fundamentals, one might set an initial target at $158 (just below resistance) and adjust the target higher if the stock breaks the resistance.
Conclusion
To find an entry signal for stocks, start with a fundamental analysis to assess the company’s financial health and valuation. Next, use technical analysis to identify bullish patterns, key support levels, and momentum indicators. Combine insights from both analyses to determine optimal entry points while setting stop-loss and target levels to manage risk. Always ensure thorough research and consider external factors before deciding.

He is an expert in financial niche, long-term trading, and weekly technical levels.
The primary field of Igor's research is the application of machine learning in algorithmic trading.
Education: Computer Engineering and Ph.D. in machine learning.
Igor regularly publishes trading-related videos on the Fxigor Youtube channel.
To contact Igor write on:
igor@forex.in.rs
Related posts:
- Forex Perfect Entry – How to Find Entry Signal in Trading?
- Best Entry Point in Forex Trading! – Previous Low or High Forex Entry Point Strategy!
- Download Chandelier Exit Indicator!
- What is the Best Forex Exit Indicator?
- What is Best Forex Signal Generator Software? – Best Free Forex Signals
- Amazon Stock Price Prediction 2050!
- How to Copy and Paste Forex Signals? – Best Forex Trade Copiers In 2024.
- Can You Make Money From Forex Signals?
- The Best Stock Market TV Channels! – What is the Best TV Channel for Stock Market News?
- Understanding and Utilizing the 7-Day Moving Average in Trading
- What is the Best Free Stock Screener?
- How to Read VWAP?
