Table of Contents
Support and resistance levels are fundamental concepts in the technical analysis used by traders to predict future price movements in financial markets, such as stocks, commodities, or currencies.
Support is a price level at which a falling asset’s price stops dropping and may start to rise due to an increase in demand or buying interest. In other words, it represents a price level or zone below the current market price where buying is strong enough to overcome selling pressure, thus preventing the price from falling further.


On the other hand, resistance is a price level at which a rising asset’s price tends to stop climbing and may start to decline due to an increase in supply or selling interest. It is a price level or zone above the current market price where selling pressure may be strong enough to overcome buying pressure, leading to a price stoppage or decrease.


These levels are identified by observing the historical price action of an asset. When the price repeatedly fails to move below a particular level, that level is considered support. Similarly, a resistance level is identified when the price fails to move above a certain point.
What is the Best Support and Resistance Indicator?
The best support and resistance indicator is automated EA based on supply and demand price levels. Additionally, the Fibonacci retracement and expansion levels indicator is an excellent choice to draw important price levels. Manually traders can draw X days high and low prices, which can also be an excellent solution to present potential support and resistance levels.

Below you can download the auto support resistance indicator:
Download supply and demand zones indicator
An automated Expert Advisor (EA) based on supply and demand price levels can effectively identify support and resistance levels. Such EAs, which can be coded and executed on platforms like MetaTrader, provide real-time, algorithm-driven market data analysis to pinpoint critical areas of supply (resistance) and demand (support).
The key advantages of using such an automated system include:
- Efficiency: The EA can process vast amounts of data quickly and accurately, far exceeding human capacity. It can also operate 24/7, particularly useful in forex markets that trade around the clock.
- Objectivity: Automated systems eliminate human bias, making decisions based solely on predefined criteria. This ensures that decisions are consistent and are based on quantitative factors.
- Visual Representation: EAs typically visually represent the identified support and resistance levels directly on the price chart. This allows traders to see the duration and extent of the highest or lowest price level in the given period, giving a clear picture of the market’s historical supply and demand.
Using Fibonacci retracement and expansion levels can further enhance the effectiveness of this approach. The Fibonacci sequence and its ratios (23.6%, 38.2%, 50%, 61.8%, and 100%) are used by traders to identify potential reversal points in the market.
By incorporating Fibonacci levels, traders can:
- Enhance Accuracy: Fibonacci levels often align closely with critical support and resistance areas, further validating these price levels.
- Identify Potential Targets: Fibonacci expansion levels often predict potential price targets following a retracement.
- Understand Market Psychology: Traders widely watch Fibonacci levels, which can lead to self-fulfilling prophecies. When many traders watch the same levels and place trades accordingly, it can cause the price to react unexpectedly.
In summary, combining an automated EA based on supply and demand levels with Fibonacci retracement and expansion levels can provide a robust, objective, and visually intuitive way of identifying and validating critical market support and resistance areas. However, as with any trading strategy or tool, applying proper risk management techniques is essential and not relying solely on one decision-making method.
Supply and Demand Area
Supply and Demand Area indicators, as the name suggests, identify zones where the forces of supply and demand have historically created significant price changes. These zones serve as potential support and resistance levels in the future.
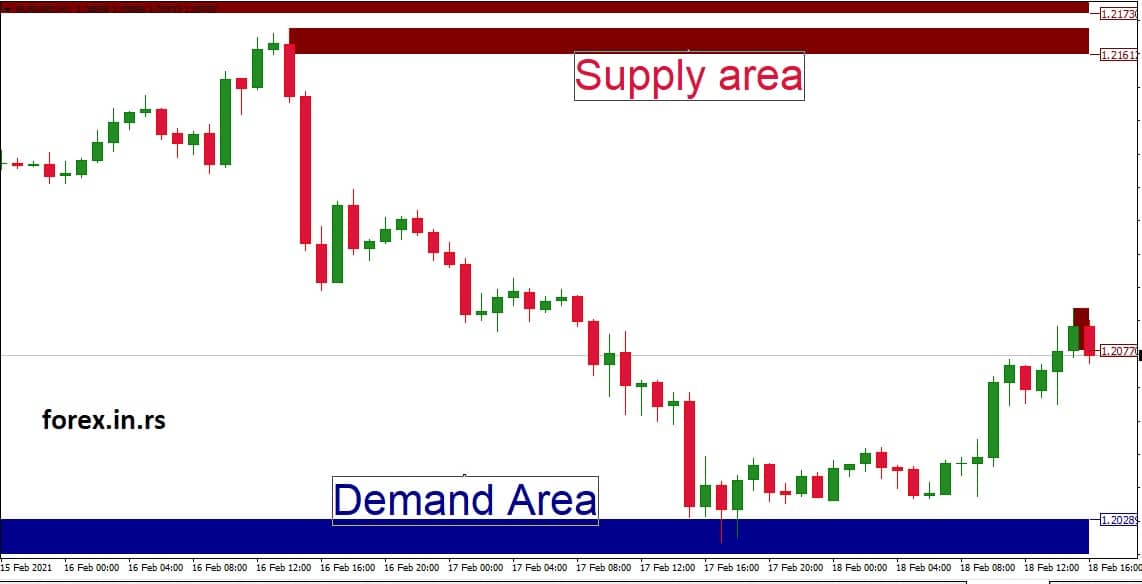
- Supply Price Areas: These are price zones where the asset’s supply has previously outweighed demand, leading to a downward price movement. When the price of an asset increases to a level where sellers are more willing to sell than buyers are to buy, the increased supply leads to a drop in price. This area effectively becomes a resistance level because it is a price point where the market has previously shown a strong inclination to sell.
- Demand Price Areas: These are price zones where the asset’s demand has previously exceeded supply, leading to an upward price movement. When the price of an asset decreases to a level where buyers are more willing to buy than sellers are to sell, the increased demand drives up the price. This area essentially becomes a support level because it is a price point where the market has previously shown a strong inclination to buy.
The basic premise of Supply and Demand Area indicators is that they identify price levels where major reversals have happened in the past due to imbalances between supply and demand. These levels are likely to see similar behavior when the price revisits them, as traders who missed the previous move might want to participate when the price returns to these levels.
Traders often use these indicators to pinpoint potential entry and exit points. For example, a trader might look to buy at a demand zone, betting that the price will bounce off the support, and sell at a supply zone, betting that the price will fall after hitting the resistance.
However, these indicators should not be used in isolation. They are more effective with other technical analysis tools and market fundamentals. Also, it’s essential to remember that these are zones, not exact price levels, meaning the price might penetrate these zones slightly before reversing.
Lastly, these areas become more potent when confirmed by high trading volume. High volume at these levels indicates strong buying or selling interest, which may make the support or resistance more robust.
Low and High Price Levels
Lows and highs of specific periods, like 7, 14, 28, and 30 days, can act as robust support and resistance levels in trading. This concept is grounded in “price memory,” which posits that significant price points in an asset’s history can influence its future behavior.
In technical analysis, traders often look at recent highs and lows as potential support and resistance levels since these price points have previously demonstrated their importance in the market. If a price level has acted as a support or resistance in the past, it may likely do so again when the price returns to this level.
- 7-Day Highs and Lows: These levels are often used for short-term trading strategies. A 7-day high can act as a resistance level because it represents a price point where sellers previously came into the market and were strong enough to halt the upward trend. Similarly, a 7-day low can be a support level, showing where buyers previously came in and were strong enough to stop the downward trend.
- 14-Day Highs and Lows: These levels are significant because they encompass two full trading weeks. As such, they can provide a more robust level of support or resistance, representing a more extended buyer or seller activity period.
- 28/30-Day Highs and Lows: These levels represent approximately one month of trading activity. A month is a standard period for reviewing performance and rebalancing portfolios so that these levels can carry significant weight. The 28/30-day high can act as solid resistance because it’s a price level at which the asset has not been able to trade above for the entire month. Similarly, the 28/30-day low can be seen as a strong support level because it’s a price level at which the asset has not traded below for the entire month.
The strength of these time-bound support and resistance levels often depends on the volume of trades at these levels. The higher the volume, the stronger the level, as many traders have shown interest at that price point.
Conclusion
Understanding support and resistance levels can help traders make informed decisions by providing insights about potential reversal points and trend strength. They can serve as markers for entry and exit points in trading strategies and are often used with other technical analysis tools to optimize trading decisions.
Remember, support and resistance levels are not exact prices but price zones, and the concept works on the principle of market psychology, reflecting points where market participants have historically shown a strong interest in buying or selling an asset. Despite their importance, they are just one tool in a trader’s arsenal, and their effectiveness can vary based on market conditions and other factors.

He is an expert in financial niche, long-term trading, and weekly technical levels.
The primary field of Igor's research is the application of machine learning in algorithmic trading.
Education: Computer Engineering and Ph.D. in machine learning.
Igor regularly publishes trading-related videos on the Fxigor Youtube channel.
To contact Igor write on:
igor@forex.in.rs
