Big banks and financial institutions employ weekly trading strategies, which are sophisticated approaches designed to maximize returns and manage risks in the dynamic world of financial markets. These strategies typically involve analyzing market data, including economic indicators, geopolitical events, and technical chart patterns. The goal is to identify potential trading opportunities that align with the institution’s investment objectives and risk tolerance.
In my video, I presented one very often used simple SMA trading strategy:


The 52-week simple moving average (SMA) is an essential indicator in technical analysis for several reasons. Firstly, it provides a longer-term perspective on an asset’s price trend by averaging the closing prices of the past 52 weeks (1 year has 52 weeks), smoothing out short-term fluctuations and noise in the data.


Secondly, the 52-week SMA is widely used by traders and investors as a reference point for identifying the overall direction of a stock or asset. When the current price is above the 52-week SMA, it can suggest a bullish trend, while being below it may indicate a bearish trend.
52 Weekly SMA Trading Strategy
Buy the asset if the weekly close price exceeds the 52-week Simple Moving Average and the RSI indicator trendline is bullish (bearish breakout). Sell the asset if the weekly close price is below the 52-week Simple Moving Average and the RSI indicator trendline is bearish (bullish breakout).
The strategy is based on the 52-week Simple Moving Average (SMA) and the Relative Strength Index (RSI), combining momentum trading techniques. The weekly assessing price of an asset’s 52-week SMA suggests a bullish trend, indicating that the asset has consistently performed well over the longer term.

In this context, traders consider buying the asset as it indicates the potential for the uptrend to continue. However, the RSI indicator serves as an additional confirmation tool. If the RSI trendline is bullish, it provides further evidence of positive momentum and strengthens the buy signal.
On the other hand, when the weekly closing price falls below the 52-week SMA, it signals a potential bearish trend, implying that the asset’s performance has been weaker over the longer term. Traders may choose to sell the asset in this scenario, anticipating a continuation of the downtrend. If in a bearish trendline, the RSI indicator adds further confirmation to the sell signal by indicating negative momentum.
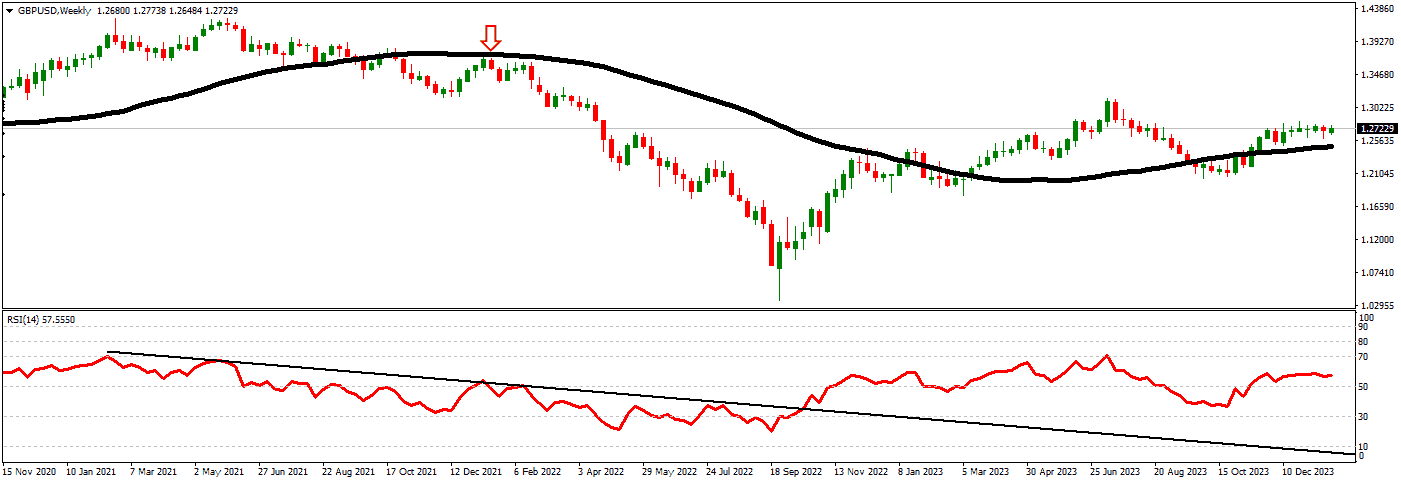
In technical analysis, a price touching a longer-term moving average like the 54-week Simple Moving Average (SMA) and then resuming a deeper bearish mode is known as a false breakout or a temporary reversal. This scenario occurs when an asset’s price, which has been in a bearish trend, manages to rise and touch or even breach the 54-week SMA briefly. This can give traders a glimmer of hope for a potential trend reversal or at least a significant bounce.
However, the bearish momentum may not have genuinely weakened, and the initial touch of the SMA can be a false signal. In such cases, after briefly interacting with the SMA, the price may continue its descent into a deeper bearish mode. This can happen for various reasons, including underlying solid bearish fundamentals or a lack of sustained buying interest.
Traders must exercise caution when interpreting these false breakouts and not assume a complete trend reversal based solely on this initial interaction with the SMA. It’s crucial to consider other technical indicators, market sentiment, and fundamental factors to understand the market’s dynamics comprehensively. False breakouts are common, and experienced traders often use risk management techniques, such as setting stop-loss orders, to protect themselves from potential losses when the trend reasserts its bearish direction.
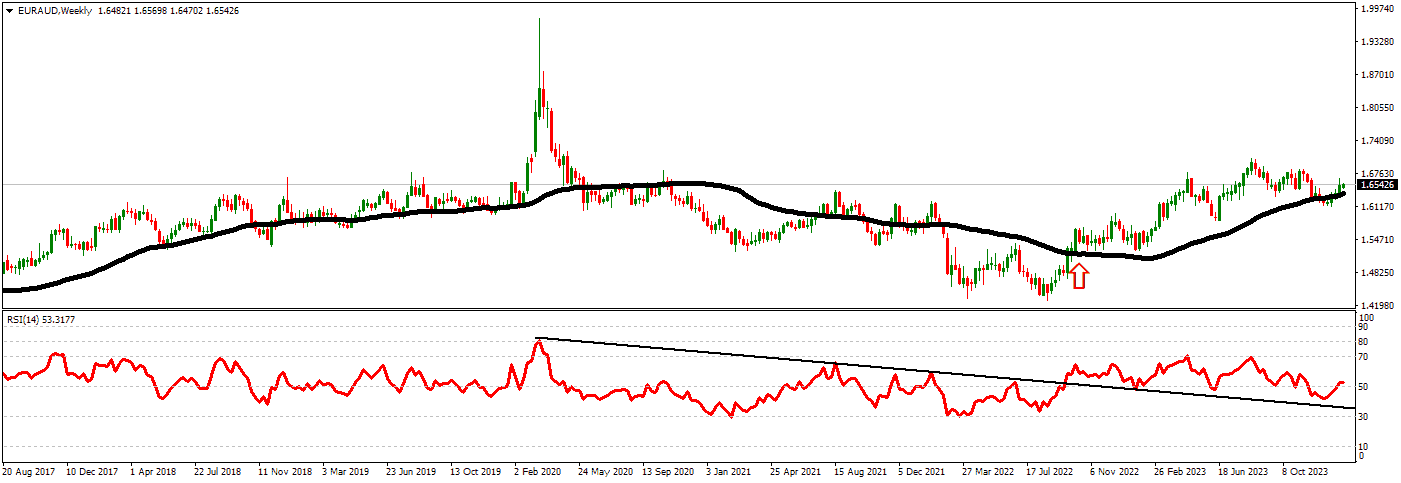
In technical analysis, the concept of previous support becoming resistance is a fundamental principle of price action dynamics. It occurs when an asset’s price, which had previously found support at a specific level, later falls below that level and then attempts to rise back toward it. In this context, the 52-week Simple Moving Average (SMA) can serve as a support and resistance level.
Weekly chart trades are often considered too close for intraday traders due to the significant difference in these two trading approaches’ time frames and objectives.
- Time Frame: Intraday trading involves making multiple trades within a single trading day, typically holding positions for minutes to hours. In contrast, weekly charts represent an entire week’s worth of price data, with each candlestick or bar representing a whole week. The time frame discrepancy means that intraday traders focus on short-term price movements, while weekly chart traders look at longer-term trends and patterns.
- Risk and Volatility: Intraday traders thrive on short-term price fluctuations and volatility to generate profits. They often use leverage and tight stop-loss orders to capitalize on these small movements. On the other hand, weekly chart trades are more suited for longer-term investors who can tolerate more significant price swings and are less concerned with intraday volatility.
- Trading Objectives: Intraday traders aim to profit from small price differentials, exploiting short-term market inefficiencies. They are primarily focused on quick gains and often engage in high-frequency trading. On the other hand, weekly chart traders have a longer-term perspective and may hold positions for weeks, months, or even years, seeking to benefit from significant price trends.
- Risk Management: Intraday traders must be highly attentive to market conditions and constantly monitor their positions. Weekly chart traders have a more relaxed trading style, as they don’t need to react to intraday price fluctuations as quickly. They can employ different risk management strategies, such as setting more expansive stop-loss levels for broader price swings.
- Analytical Approaches: Intraday traders rely on short-term technical analysis, intraday charts, and minute-to-minute news events. Weekly chart traders use longer-term technical and fundamental analysis to make informed decisions, considering less relevant factors for intraday traders.
The choice between weekly chart trades and intraday trades depends on a trader’s goals, risk tolerance, and trading style. Intraday trading is fast-paced and demands constant attention, while weekly chart trading is more patient and suited for investors with a longer-term outlook.

He is an expert in financial niche, long-term trading, and weekly technical levels.
The primary field of Igor's research is the application of machine learning in algorithmic trading.
Education: Computer Engineering and Ph.D. in machine learning.
Igor regularly publishes trading-related videos on the Fxigor Youtube channel.
To contact Igor write on:
igor@forex.in.rs
Related posts:
- Forex Weekly Strategy Based on 200 Moving Average
- Download Daily Weekly Monthly High Low Indicator for the MT4
- Fibonacci Retracement Trading Strategy! – Golden Ratio Strategy!
- 52 Week High Low Strategy
- The Best Divergence Trading Strategy
- How to Get Funded for Forex Trading?
- The Best 4h Trading Strategy
- 1-minute Scalping Trading Strategy Example Using EMA20
- VIX and Stochastic RSI Strategy – Volatility-Based Trading Strategy!
- The Best Forex Trading Strategy that Work?
- Engulfing Trading Strategy – Case Study
- Pivot Point Bounce Trading Strategy
