A 52-week high or low in technical analysis is crucial for understanding market sentiment and potential price movements. These levels represent the highest and lowest prices a stock has traded in the last year, offering critical insights into investor behavior. A 52-week high can signal bullishness, indicating strong investor confidence and potentially triggering further buying as the price breaks through this level. Conversely, a 52-week low might suggest bearish sentiment, where prices could either rebound upon hitting a support level or continue to decline.
See my video how I explained this strategy:


Traders often use these markers to set up trading strategies, such as buying near the 52-week low in anticipation of a rebound or selling as a stock approaches a 52-week high to lock in profits. Overall, these levels are important indicators in technical analysis, helping traders to gauge market trends and make informed decisions.


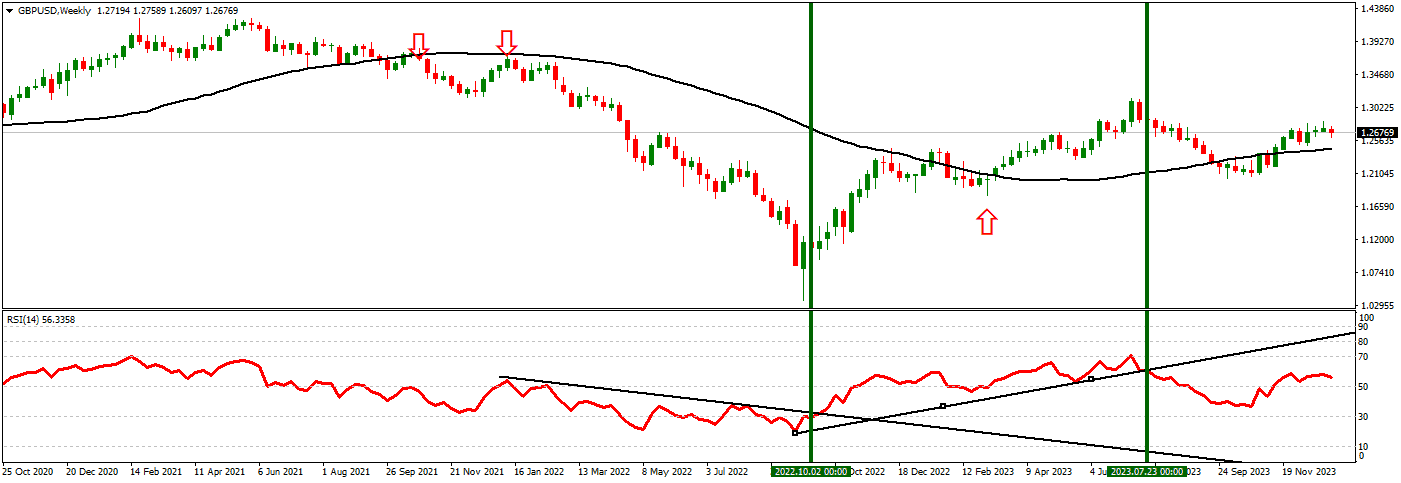
As you can see, in September 2021, the bearish candle (the entire candle below SMA 52 on the weekly chart) went almost the whole year in a bearish trend from 1.346 to 1.074.
We can use SMA 52 or RSI trendline to exit the trade to mark the primary trend’s breakout.
52 Week High Low Strategy
- Identify 52-Week High/Low: Locate the highest and lowest prices of a stock or forex asset over the past 52 weeks. These are significant psychological levels for traders.
- Plot 52-Week Moving Average on Weekly Chart: This moving average helps identify the long-term trend by averaging the weekly price movements over the past year.
- Use Full Candle Above/Below Moving Average for Confirmation:
- Ensure a complete weekly candle closes above the 52-week moving average before considering a bullish position to avoid false breakouts.
- Similarly, for a bearish position, confirm that an entire candle closes below the moving average.
- Buying Strategy at 52-Week Low:
- Consider a buy position when the price approaches the 52-week low but rebounds with a whole candle closing above the 52-week moving average, suggesting a potential trend reversal.
- Use other indicators or patterns for additional confirmation.
- Selling/Shorting Strategy at 52-Week High:
- Contemplate selling or shorting when the price is near the 52-week high, and an entire candle closes below the moving average, indicating a potential downtrend.
- Incorporate RSI Trendline:
- Draw a trendline on the RSI indicator.
- Close the trade if the trendline on the RSI is broken, as this could signal a change in the momentum and potentially invalidate the trading setup.
- Risk Management:
- Place stop-loss orders appropriately to limit potential losses. For buys, set it below the 52-week low, and for sells, above the 52-week high.
- Monitor the trade closely, particularly around these critical levels.
- Adapt Strategy According to Market Context: Be adaptable to changing market conditions and integrate both technical and fundamental analysis for a comprehensive approach.
This Strategy focuses on waiting for an explicit confirmation with a complete candle above or below the moving average to avoid false signals. It uses the RSI trendline to validate the trade further. Remember, no strategy guarantees success, and combining various analytical methods for more robust trading decisions is essential.

52 Week SMA on Weekly chart (S&P500)
During this period, the 52-week SMA was plotted on the weekly chart of the S&P 500. This moving average smooths out price fluctuations over the past year and indicates the long-term trend. From January 2020 to January 2022, the S&P 500 exhibited a bullish trend, consistently trading above this 52-week SMA. This indicated strong market sentiment and an ongoing upward trend in the stock market.
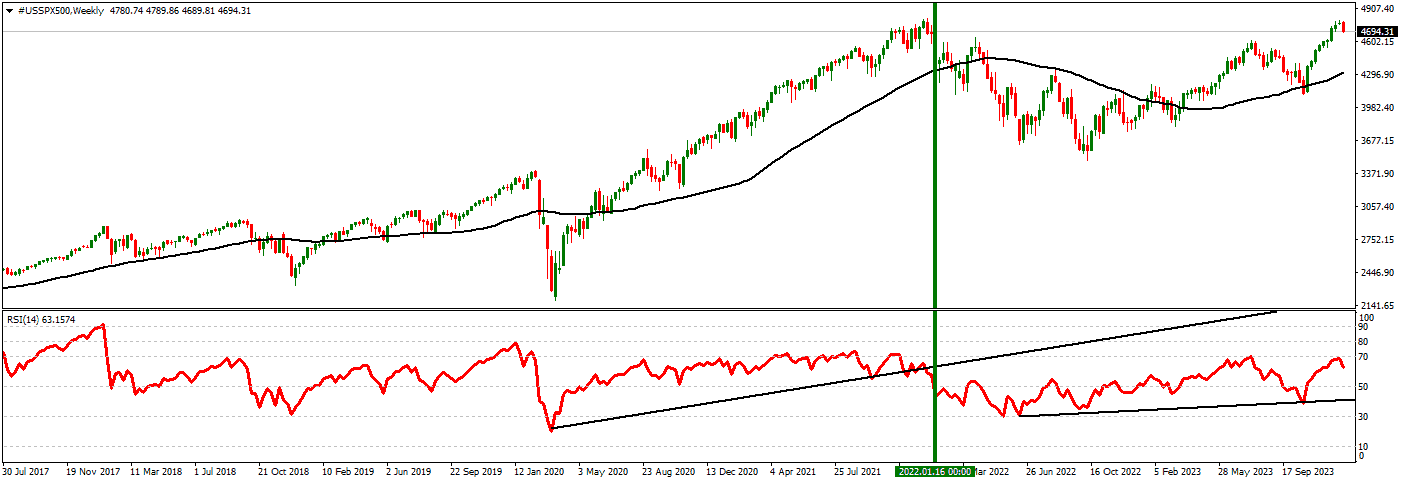
Concurrently, the Relative Strength Index (RSI), a momentum oscillator, was utilized to gauge the trend’s strength and identify potential reversals. A trendline was drawn on the RSI to track its progression. Initially, the RSI maintained a trendline that corroborated the bullish trend observed in the price action. This trendline acts as a support for the RSI, indicating sustained buying momentum.
However, a significant development occurred when the RSI trendline was broken. This break happened when the S&P 500 traded between 3057 and 4296 points. The breaking of the RSI trendline signaled a potential shift in momentum, suggesting that the bullish sentiment was weakening. Traders could interpret such a break as an early warning of a trend reversal or a significant market correction.
This period is a classic example of how combining the 52-week SMA with the RSI trendline can provide valuable insights into market trends and potential reversals. While the 52-week SMA helps identify the long-term trend, the RSI and its trendline offer an additional layer of analysis to detect changes in momentum, which are crucial for making informed trading decisions.
Conclusion
I wanted to create something for traders and investors who work and do not have time for intraday trading.
For long-term investors, the key is not to monitor the charts daily but to periodically review their investments to ensure they align with their overall investment goals. This approach is less about timing the market and more about time in the market. Long-term investors might use the 52-week SMA to understand the general trend of the market but wouldn’t typically use it to make frequent trading decisions. Similarly, while the RSI can indicate potential reversals or shifts in market momentum, it is often utilized more by traders looking to time their entries and exits rather than long-term investors.
The ideal Strategy for long-term investing involves selecting a diversified portfolio that aligns with one’s risk tolerance and investment horizon and then periodically reviewing and rebalancing the portfolio, perhaps a few times a year.
You should monitor the Interest rate for both currencies (if you trade forex) because any change can shift trends.

He is an expert in financial niche, long-term trading, and weekly technical levels.
The primary field of Igor's research is the application of machine learning in algorithmic trading.
Education: Computer Engineering and Ph.D. in machine learning.
Igor regularly publishes trading-related videos on the Fxigor Youtube channel.
To contact Igor write on:
igor@forex.in.rs
