Table of Contents
Candlesticks in trading visually represent price action within a specific time frame, showing the open, high, low, and close prices. The main body of a candlestick indicates the opening and closing prices, while the lines or “wicks” extending from the body represent the high and low prices during the period.
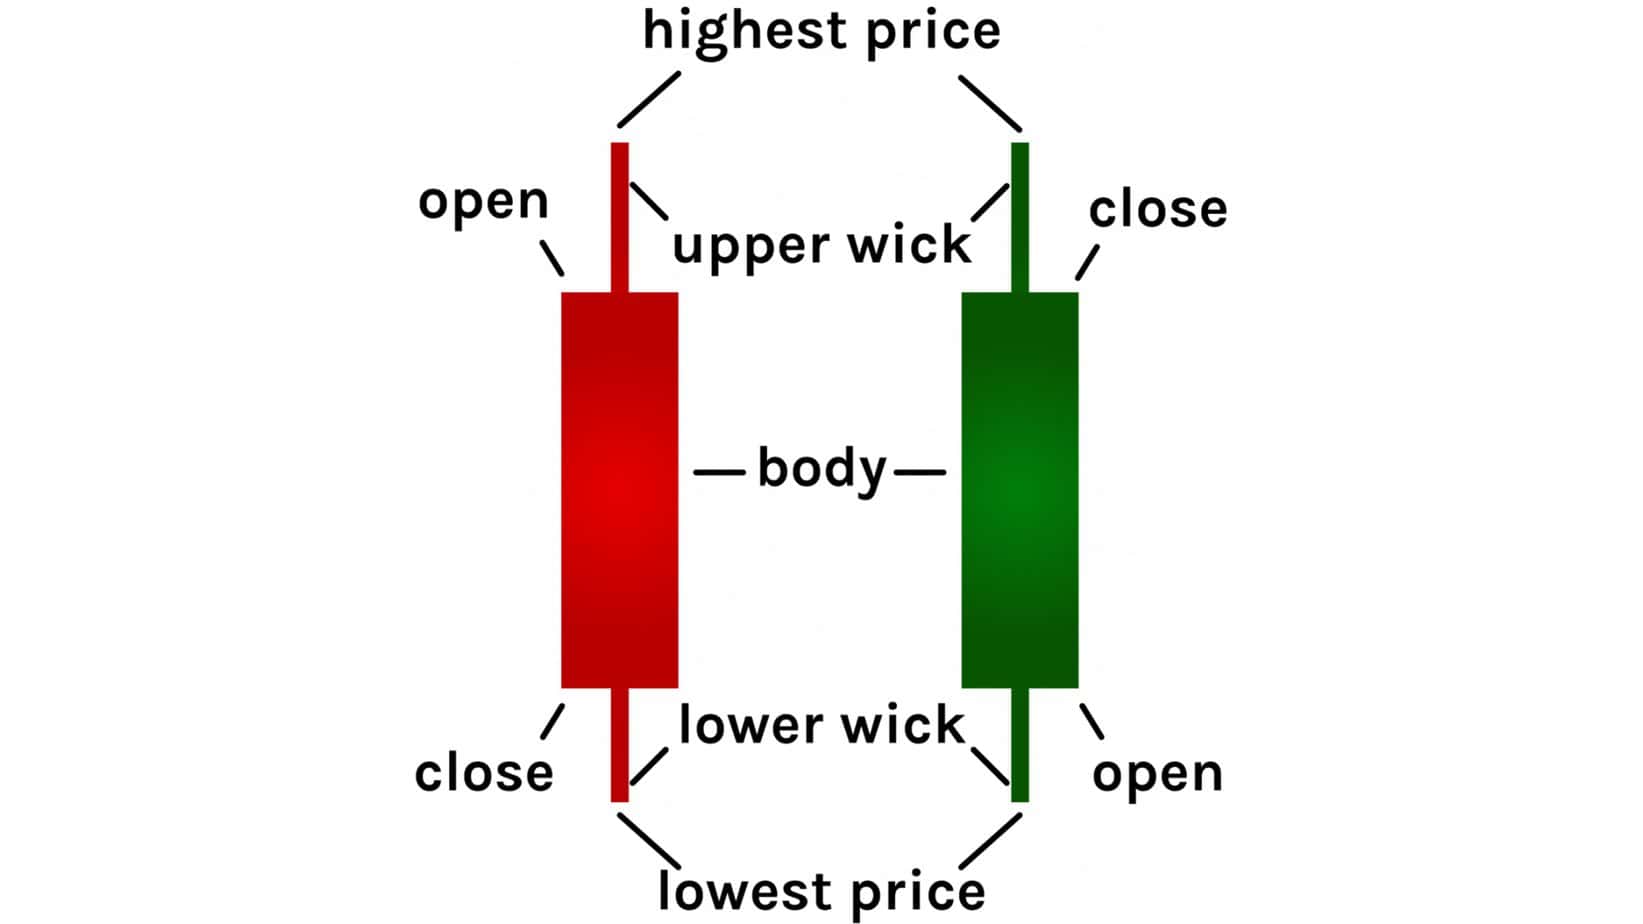


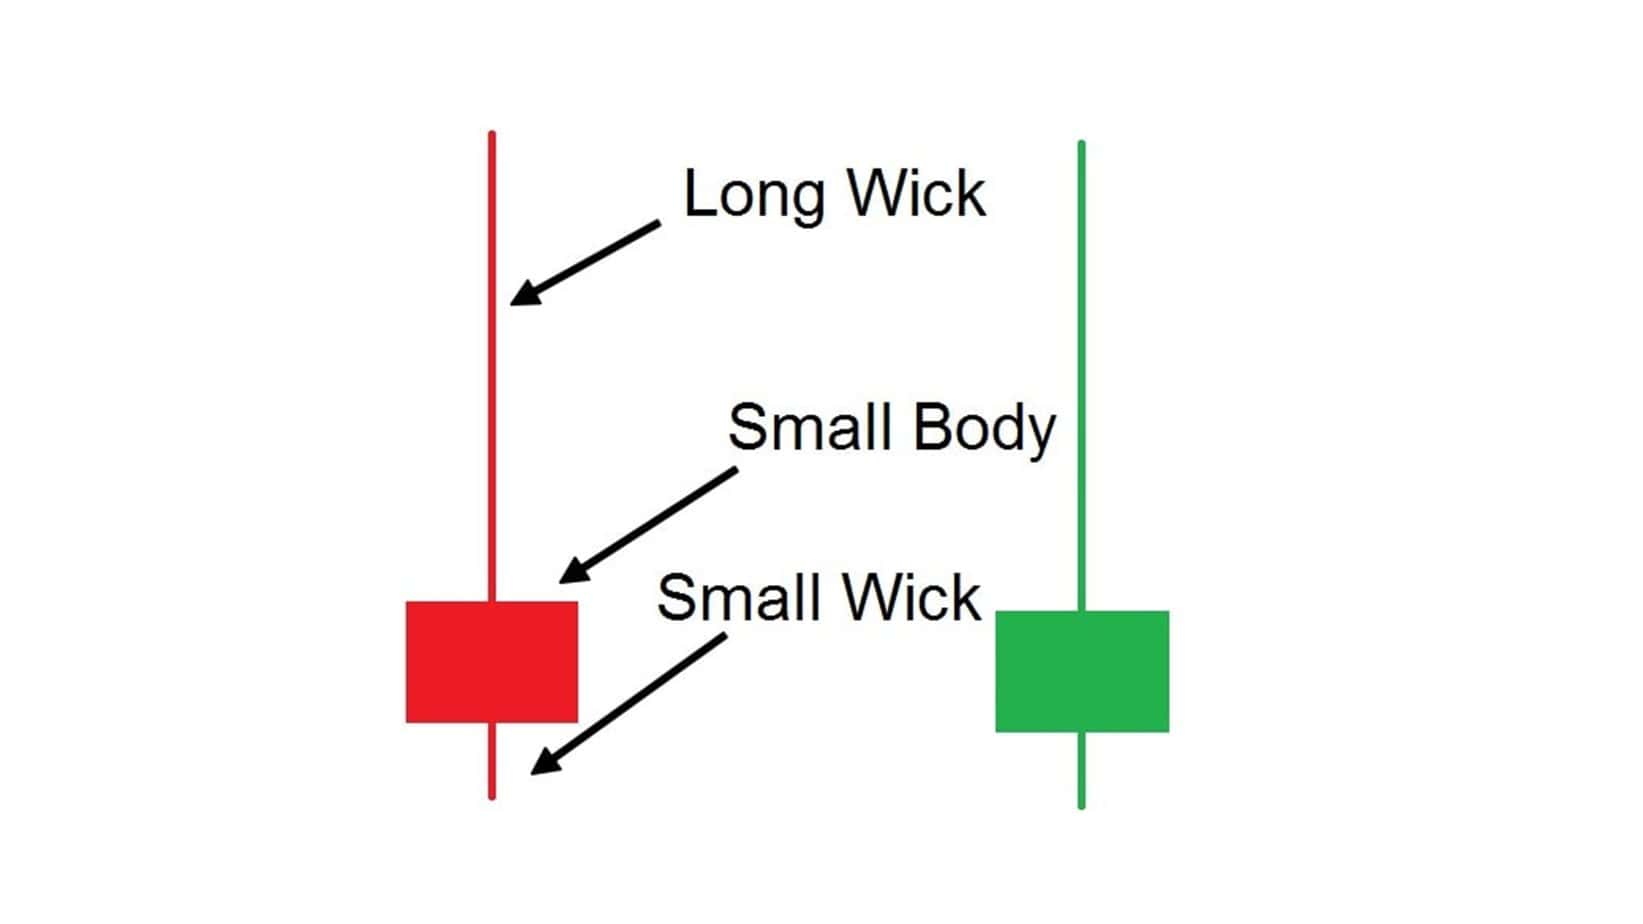
The color of the candlestick body can signify whether the closing price was higher (often white or green) or lower (usually black or red) than the opening price. Wicks, also known as shadows, provide key insights into the market’s volatility during the candlestick’s time frame, with longer wicks indicating greater price movement. Understanding the patterns formed by candlesticks and their wicks can help traders make informed decisions about market trends and potential reversals.


What Mean in Forex Wick-Fill Strategy?
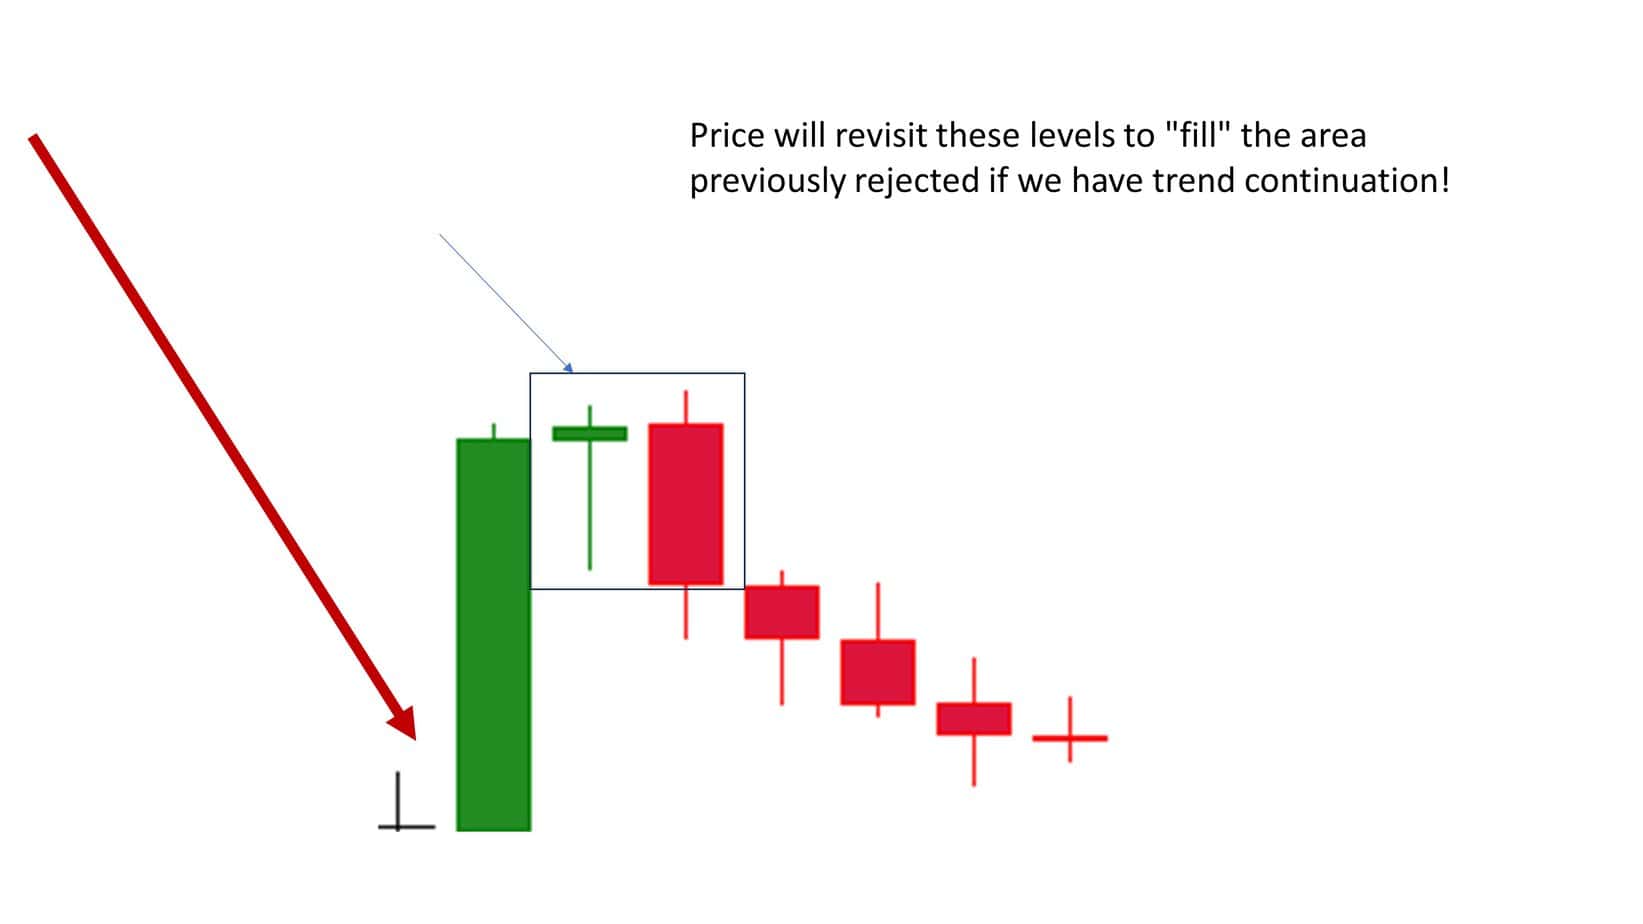
The WickFill strategy refers to a trading approach in which the price tends to “fill up” the previous counter trade wick during strong bullish or bearish trends. Therefore, if during a solid rising trend, a candle has a long wick price rejection (short-time bearish move), the next candle price tends to go bullish to fill the previous wick downtrend.
Please watch my video from my YouTube channel:

Traders often employ a multi-timeframe analysis strategy to enhance their trading decisions. This strategy involves analyzing the exact market or security across different timeframes to view the market’s trends and movements comprehensively.
Elliott Wave Theory suggests that markets move in repetitive cycles influenced by investor psychology. These cycles comprise eight waves: five in the direction of the trend (impulse waves) and three against it (corrective waves).
For example, let us analyze one trading situation:
We can see the wick if we have a strong bearish trend and a false breakout on the chart. However, this wick is not price rejection, only a corrective wave:
Distinguishing between price rejection at support and resistance levels and a corrective wave within a solid bearish or bullish trend is crucial for traders, as it can significantly influence trading decisions and strategy. Here’s how to make the distinction:
Price Rejection at Support and Resistance
- Visual Clues: Price rejection often manifests as a pin bar or a hammer candle on a chart, with a long wick touching or penetrating the support or resistance level but with the body rejecting and closing away from that level. This indicates that, despite attempts to push past a support or resistance level, there’s not enough market consensus to sustain the break.
- Timeframe: Price rejections are usually observed on shorter timeframes and can happen swiftly. They represent immediate market reactions to specific price levels rather than a prolonged trend.
- Volume: An increase in trading volume during the price rejection can indicate strong interest or opposition at that price level, reinforcing the validity of the support or resistance.
Corrective Wave in Elliott Wave Theory
- Pattern Recognition: Corrective waves are part of a larger wave pattern. They occur after a significant move in the market (impulse wave) and are characterized by a series of lower highs and lower lows (in a bearish trend) or higher lows and higher highs (in a bullish trend). Identifying these waves requires analyzing the market holistically, often over longer periods.
- Sequence and Proportion: Corrective waves follow impulse waves in a predictable sequence (such as the 5-wave impulse followed by a 3-wave correction in Elliott Wave Theory). Their proportion and structure (e.g., zigzag, flat, triangle) also provide clues about the market’s next move.
- Contextual Analysis: Understanding whether a movement is part of a corrective wave often requires contextual analysis, including considering the market’s overall trend, wave counts, and potential Fibonacci retracement levels that coincide with the start and end points of the waves.
Combining Both Approaches for Clarity
- Multiple Timeframes: Analyzing price movements across multiple timeframes can help distinguish between a temporary price rejection and a more significant corrective wave. For example, what appears as a price rejection in a short timeframe may be part of a corrective wave pattern in a longer timeframe.
- Fibonacci Retracements: Applying Fibonacci retracements to the impulse waves can provide additional support and resistance. Corrective waves often retrace a significant portion of the impulse wave, typically to the Fibonacci levels of 38.2%, 50%, or 61.8%. A bounce from these levels might indicate a corrective wave rather than mere price rejection.
- Market Sentiment and Volume: Understanding the underlying market sentiment and analyzing volume can also aid in differentiation. Corrective waves might show a gradual decrease in volume over time, whereas price rejection might occur with a sudden spike in volume as traders quickly react to a support or resistance level.
Price rejection or WickFill
WickFill occurs amid a solid bullish or bearish trend outside support and resistance. On the contrary, wick price rejection occurs on support and resistance.
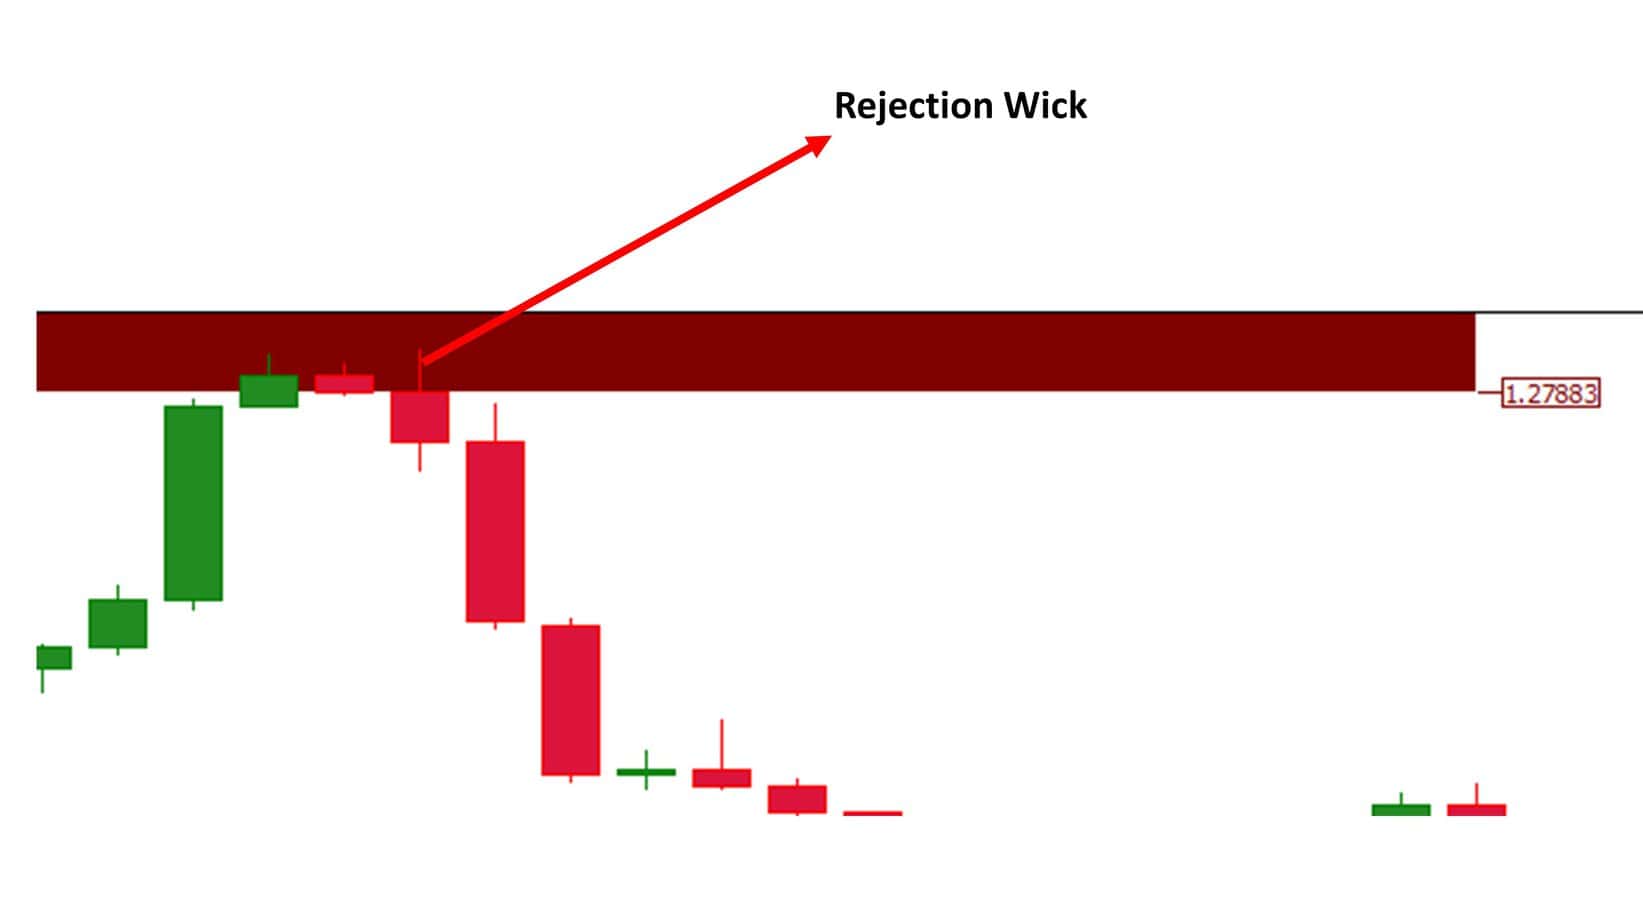
In the image above, we can see price rejection in the resistance zone.
Here again is a new example:

WickFill Strategy on Daily and Hourly Chart
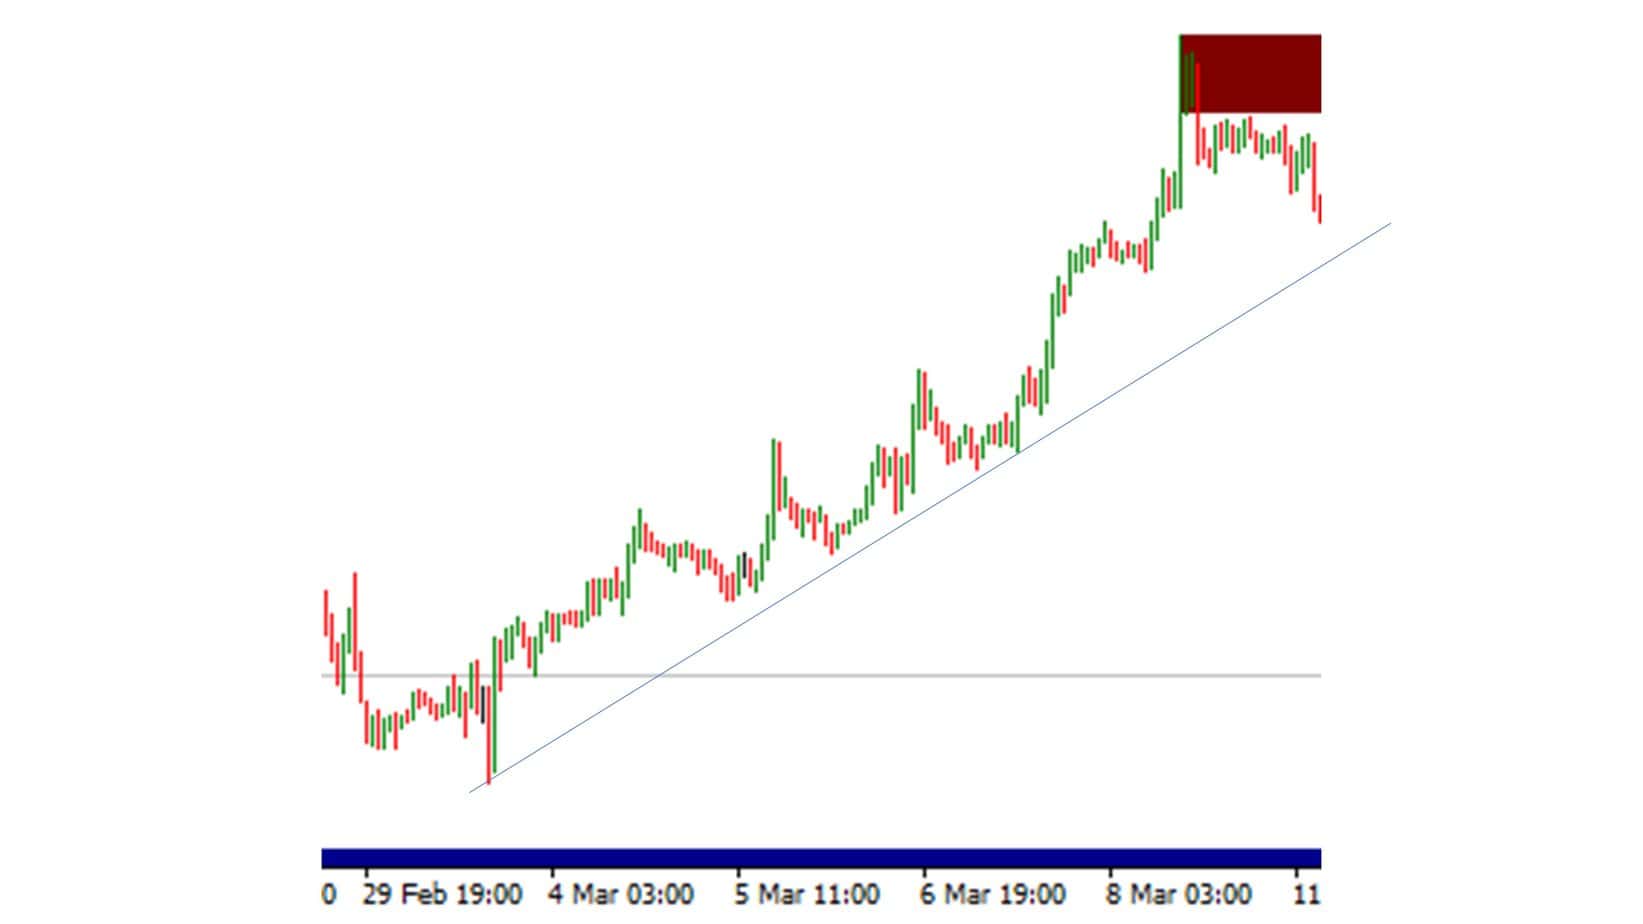
Let us analyze the WickFill strategy using Daily and Hourly charts.
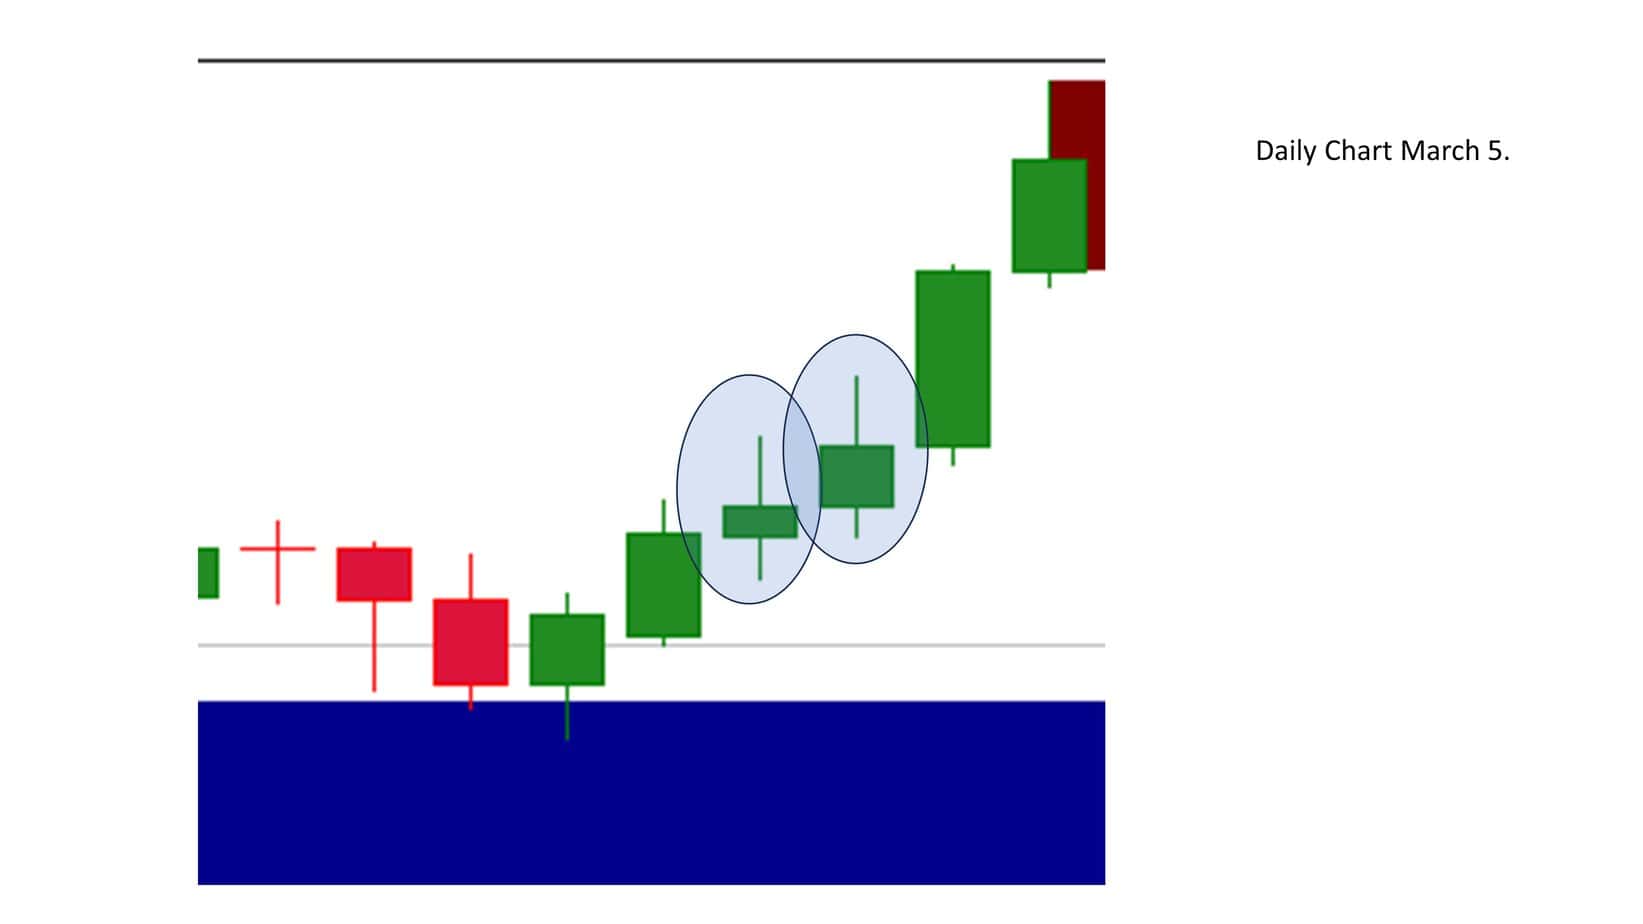
As you can see, on March 5 and March 6, we had long wicks on daily charts. Using a 1-hour chart, we can detect two bearish waves in a strong bullish trend and enter into buy trades after pullbacks.
Below is an hourly chart with two bearish waves (daily chart wicks) where we can enter the trade after a pullback.
Conclusion
The WickFill strategy is a nuanced approach that leverages the market’s natural tendency to ‘fill’ the gaps left by price rejections within solid trends. This strategy is predicated on the understanding that amid a strong bullish or bearish movement, the market often exhibits temporary counter-trend retractions, manifested as long wicks on candlestick charts. These wicks represent short-term opposition to the prevailing trend, but ultimately, they are seen as opportunities for the trend to resume with even greater vigor.
In essence, the WickFill strategy involves identifying these moments of price rejection — when a candle in a strong trend displays a significant wick in the opposite direction — and anticipating that subsequent price action will move to ‘fill’ this gap. This means that if, during an uptrend, a candle forms with a long downward wick (indicating a brief bearish sentiment), the strategy would predict that the next candle(s) will likely push upwards, covering the ground represented by the previous wick, thus continuing the bullish trend.
This strategy harnesses the principles of market psychology and momentum. The long wick represents a temporary lapse in the prevailing trend’s dominance, often due to profit-taking or short-term speculative trades against the trend. However, the inability of this counter-trend movement to sustain itself becomes apparent when the market quickly resumes its initial direction, thereby ‘filling’ the wick.
Implementing the WickFill strategy effectively requires a trader to:
- Identify Strong Trends: Recognize strong, bullish, or bearish trends through technical indicators and market sentiment analysis.
- Spot Price Rejections: Look for candles with long wicks against the trend direction as potential indicators of temporary price retractions. Look only at outside resistance and support.
- Confirm Market Sentiment: Use additional tools, such as volume analysis, Elliott Wave Theory, and Fibonacci retracements, to ensure the market sentiment aligns with the strategy’s assumptions.
- Execute Timely Trades: Enter trades with the expectation that the next candle(s) will move to fill the wick, setting appropriate stop losses to manage the risk if the trend does not resume as expected.
The WickFill strategy, therefore, is not just about observing candlestick patterns in isolation but involves a holistic analysis of market trends, psychology, and momentum. It offers traders a sophisticated method to capitalize on markets’ natural ebb and flow, aligning with the inherent tendencies of price action to seek equilibrium after short-term disturbances.

He is an expert in financial niche, long-term trading, and weekly technical levels.
The primary field of Igor's research is the application of machine learning in algorithmic trading.
Education: Computer Engineering and Ph.D. in machine learning.
Igor regularly publishes trading-related videos on the Fxigor Youtube channel.
To contact Igor write on:
igor@forex.in.rs
