Table of Contents
Forex trading is a complex labyrinth of trends, movements, and signals. However, amidst this complexity lie patterns—recurring and identifiable formations in price data—that traders have come to recognize and rely upon.
These patterns, formed by the oscillation of currency prices, can be instrumental in predicting potential future price movements. Alongside patterns, certain price levels stand out due to their recurring significance. These levels, often called support and resistance, act like invisible barriers where the price tends to bounce back or break through, reflecting market participants’ underlying psychology and decision-making. Understanding and leveraging patterns and crucial price levels is paramount for any trader navigating the Forex market precisely and confidently.


Let us see What the Break of Structure in Forex is:


What Does BOS Mean in Trading?
BOS or “Break of structure” represents a trading term indicating a potential change or shift in the market’s direction. BOS term presents significant price level breakouts such as resistance, support, or any trendline. Usually, a “Break of structure” can happen when the price changes direction during the reversal patterns.
Trading patterns are formations created by the price movements of an asset on a chart. Recognizing and understanding these patterns can help traders anticipate potential future price movements. Trading patterns can be classified into two main categories: continuation and reversal.
- Continuation Patterns: Continuation patterns suggest that the current market trend will continue.
- Flag: This looks like a small rectangle that slopes against the prevailing trend. It’s usually a short-term pattern.
- Pennant: This is similar to a flag but appears as a small symmetrical triangle that begins wide and converges as the pattern matures.
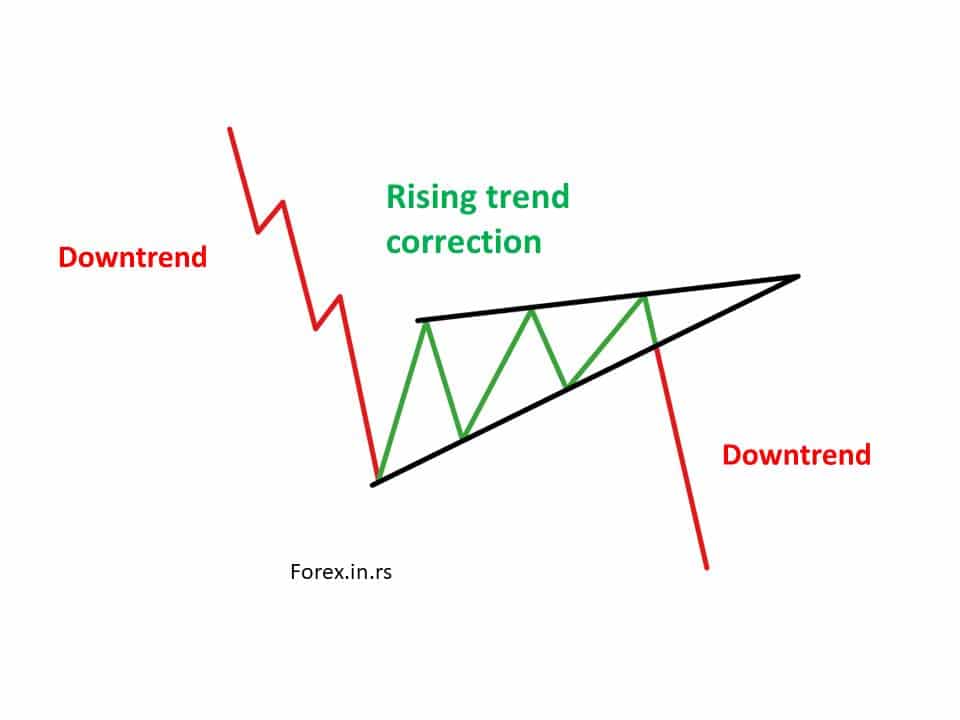
- Wedge: This pattern can be rising or falling. A rising wedge can signal a bearish reversal (if it occurs after an uptrend) or a bullish continuation (after a downtrend). Conversely, a falling wedge can signal a bullish reversal or bearish continuation.
- Symmetrical Triangle: This is where the support and resistance lines converge toward each other. The breakout direction can be in the direction of the prevailing trend (continuation) or opposite to it (reversal).
- Reversal Patterns: Reversal patterns indicate a potential change in the current trend.
- Head and Shoulders: This pattern has a peak (head) flanked by two smaller peaks (shoulders). An inverse head and shoulders pattern is a bullish reversal pattern, while a regular head and shoulders are bearish.
- Double Top: This bearish reversal pattern appears after an uptrend and is characterized by two peaks roughly at the same price level.
- Double Bottom: This is the opposite of the double top. A bullish reversal pattern appears after a downtrend and features two troughs at roughly the same price level.
- Triple Top and Bottom: Similar to the double top and bottom, but with three peaks or troughs.
- Rounding Bottom: This pattern resembles a bowl and signifies a reversal from a bearish trend to a bullish one.
- Cup and Handle: This pattern looks like a teacup, representing a pause in the trend before breaking out to new highs.
- Other Patterns:
- Rectangle occurs when the price moves between horizontal support and resistance lines.
- Ascending and Descending Triangle: These patterns are characterized by a flat resistance line with ascending support for the ascending triangle and a flat support line with descending resistance for the descending triangle.
A “Break of Structure” in the trading context refers to a point where a chart’s established pattern or structure of price movement is disrupted. This interruption can signify a potential shift in the market’s prevailing trend.

Components
- Market Structure:
- This encompasses the consistent highs and lows that a market forms over time.
- In an uptrend, you generally see a pattern of Higher Highs (HH) and Higher Lows (HL). Conversely, you’ll observe Lower Highs (LH) and Lower Lows (LL) in a downtrend.
- Support and Resistance Levels:
- Support is the price level at which a currency or stock tends to stop falling and may even bounce back upwards. It’s like a safety net or floor where the asset finds buying interest.
- Resistance: Opposite support, this is a price level at which a currency or stock tends to stop rising and may reverse direction. It acts like a ceiling where selling interest is typically found.
- Trendlines:
- These are drawn on charts to help visualize the direction of price movements. An upward trendline is drawn below the price, connecting HLs, while a downward trendline is drawn above the price, connecting LHs.
How BOS Occurs?
- Reversal Patterns:
- These are chart patterns that indicate potential reversals in the ongoing trend. Classic examples include the “Head and Shoulders,” “Double Tops,” and “Double Bottoms.”
- When price action moves against the prevailing trend and completes a reversal pattern, it often leads to a BOS.
- Breach of Support or Resistance:
- A BOS is confirmed when the price breaches a significant support level during a downtrend or surpasses a resistance level during an uptrend.
- Trendline Breaks:
- When the price of an asset crosses a trendline, it’s a classic BOS scenario. For instance, if the price breaks below the upward trendline in an uptrend, it signals potential weakness.
Significance of BOS
- Shift in Market Sentiment:
- A BOS often indicates that the prevailing market sentiment is changing. For instance, if there’s a BOS during an uptrend, it might suggest that buyers are losing control and sellers are beginning to dominate.
- Trading Opportunities:
- Many traders use the BOS as an entry or exit signal. For example, a break below a significant support level could be seen as a selling opportunity.
- Risk Management:
- Recognizing a BOS can be crucial for managing risk. If a trader is in an extended position and notices a bearish BOS, it might be prudent to consider exiting the trade or setting a stop-loss.
Conclusion
While the Break of Structure is a powerful tool for interpreting market movements, it’s essential to approach it cautiously. No single technical indicator or pattern can predict market movements with certainty. Therefore, combining the BOS concept with other technical analysis tools, fundamental analysis, and robust risk management strategies is advisable for comprehensive trading decision-making.

He is an expert in financial niche, long-term trading, and weekly technical levels.
The primary field of Igor's research is the application of machine learning in algorithmic trading.
Education: Computer Engineering and Ph.D. in machine learning.
Igor regularly publishes trading-related videos on the Fxigor Youtube channel.
To contact Igor write on:
igor@forex.in.rs
Related posts:
- How to Use AI in Forex Trading?
- MACD vs. RSI – Which Indicator Gives Better Trading Results?
- How to Avoid Choppy Price in Trading?
- How I Use The Dollar Index (DXY) To Increase Trading Profits? – Useful Live DXY Trading Example!
- What is Copy and Paste Forex Trading or Mirror trading?
- Is RSI Good For Day Trading? – RSI Time-Frame for Day Trading
- Day Trading as a Side Hustle! – Why I Do Not Like Day Trading?
- Options Trading vs Forex Trading
- Forex Trading Essentials – Essential Guide to Forex Trading
- How to Start Forex Trading? – 12 Steps to Master Forex Trading
- Does HF Markets Allow Bot Trading? – HFM EA Trading
- What is Order Level Trading – Various Types Of Trading Order
