The US Dollar Index (DXY) measures the value of the United States dollar relative to a basket of foreign currencies, often including the Euro, Japanese Yen, British Pound, Canadian Dollar, Swedish Krona, and Swiss Franc. It is used to gauge the overall international value of the USD, providing insight into the international exchange rates and the strength of the USD in global markets.
However, the DXY cannot be directly traded on platforms like MT4, MT5, and others because it is an index, not a tradable asset like currencies, commodities, or stock indices. These platforms typically offer trading on currency pairs, commodities, stocks, and other financial instruments. Still, the DXY is a reference measure, requiring derivative products like futures or options (available on other platforms) to speculate on its movements.
Please watch my video about this live trading example :


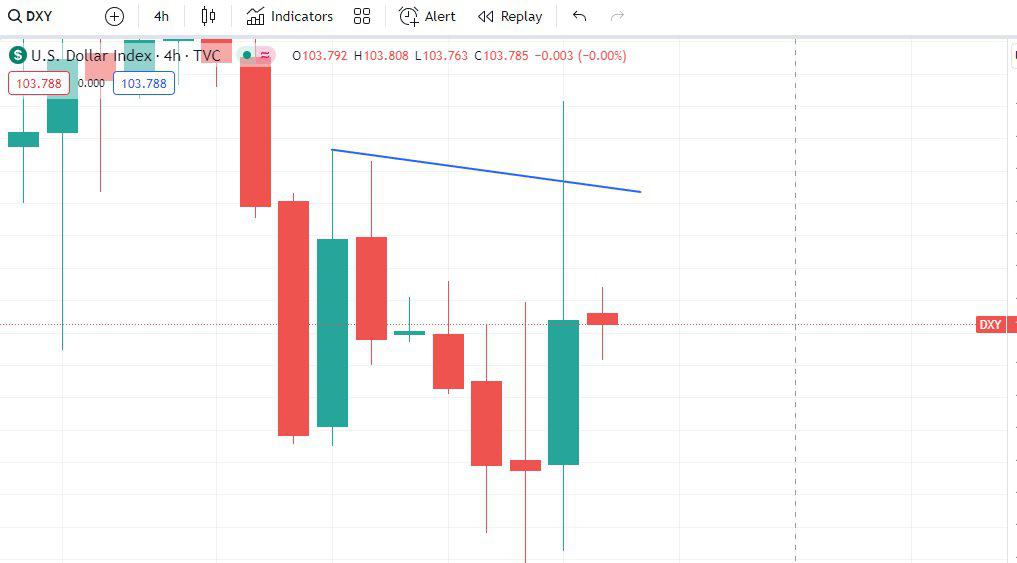
Traders can identify key price levels that signal potential market movements by analyzing the Dollar Index (DXY) for resistance, support, and trendlines. When the price touches these critical levels, traders execute trades on major currency pairs, leveraging the insights gained from DXY trends to increase their trading profits by predicting the direction of the USD’s movement relative to other currencies.
See the example from 27. February 2024:

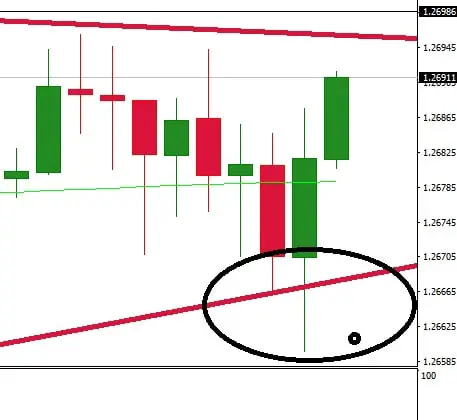
In the latter half of February 2024, the price movement demonstrated a significant adherence to a strong support trendline. This pattern offers a fascinating insight into market dynamics and trader psychology. This trendline served as a pivotal psychological and technical barrier, indicating a level at which buyers consistently found value, preventing the price from falling further. On the day in question, the price touched this critical support level at 1.266 for the seventh time, a recurrence that underscores the resilience of this support level and the market’s collective trust in it as a foundational floor for price action.
See my GBPUSD chart and strong support:
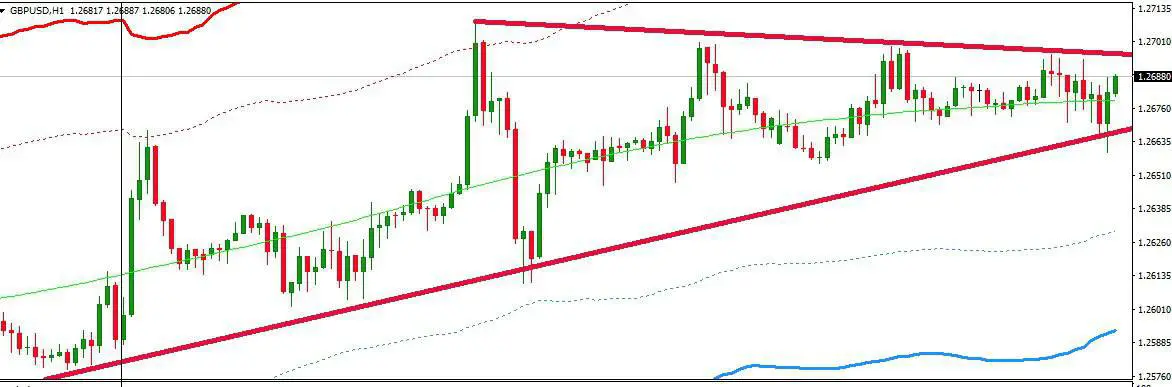
Such repeated touches to the support level without a breakthrough often reinforce the strength of the support, signaling to traders and investors alike that there is substantial buying interest at this price point. The immediate price movement following this seventh touch—ascending to 1.27 and then to 1.273—can be interpreted as a bullish response, suggesting a solid buying pressure emerging after the price interacted with the support. This upswing reflects a recovery from the support level. It indicates a potential shift in market sentiment from bearish to bullish, as participants interpret the hold at the support level as a sign of underlying strength.
The phenomenon where the price respects a trendline multiple times, especially in a market scrutinized for significant currency pairs, speaks volumes about the collective market psychology and the strategic play of supply and demand. Traders monitoring such movements might see these interactions as confirmations of the trendline’s validity, using them as a basis for making informed decisions. The bounce from 1.266 to higher levels suggests that the market consensus viewed the vicinity around the support trendline as an opportune moment for entry, anticipating that the sustained demand at this level would eventually push prices higher.
Moreover, this scenario encapsulates the essence of technical analysis, where traders look for patterns and signals in price movements and consider the frequency and context of these signals. The transition from touching a significant support level to climbing suggests a tactical point for traders to consider entering trades based on the expectation that the support level will hold and lead to an upward price correction. This strategy hinges on the belief that historical price actions, like the consistent defense of a support level, provide clues about future market movements.
Conclusion
By closely monitoring the Dollar Index (DXY) and identifying critical support and resistance levels, traders can gain valuable insights into potential market movements, allowing for strategic trade placements in major currency pairs.
The live trading example of the DXY touching a strong support level and subsequently rising illustrates how understanding these key price points can be leveraged to make informed trading decisions, potentially increasing trading profits. Such practical applications of DXY analysis exemplify its utility in enhancing trading strategies by providing a broader context of the USD’s performance against a basket of currencies.

He is an expert in financial niche, long-term trading, and weekly technical levels.
The primary field of Igor's research is the application of machine learning in algorithmic trading.
Education: Computer Engineering and Ph.D. in machine learning.
Igor regularly publishes trading-related videos on the Fxigor Youtube channel.
To contact Igor write on:
igor@forex.in.rs
