Table of Contents
When you’re into trading, any insight is highly appreciated. Both MACD and RSI indicators can inform you whenever a security’s price increases or decreases faster. There is a constant competition between these two as it is said an RSI indicator is more capable and successful than the other one, with lesser wrong trading signals. But, certain factors claim a MACD indicator to be much better and accurate.


Are you wondering which one should you go for? Check out a detailed comparison of the two and which is the best momentum indicator right here in this article ahead.


What is the MACD indicator?
MACD indicator represents trend-following momentum indicator that consists of “fast” line, “slow” line, signal line, and histogram to give bullish and bearish signals. Default settings are The 12 period exponentially weighted average (EMA) for the ‘fast line,’ The 26 period EMA for ‘slow line,’ and nine period EMA for the signal line.
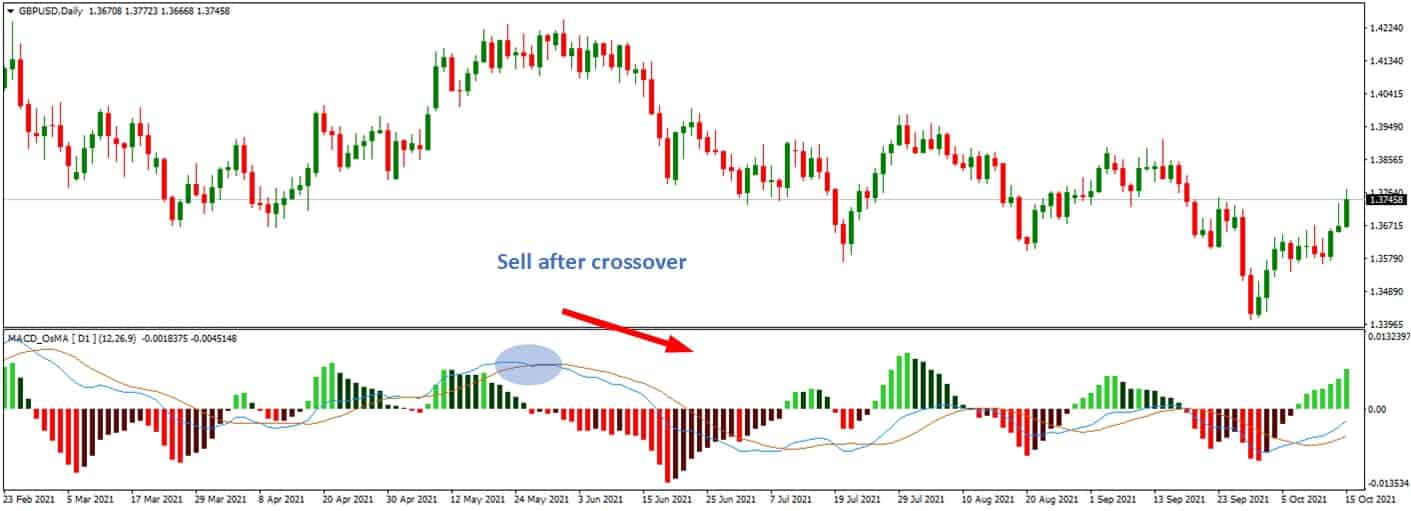
Above is presented MACD with two lines indicator. You can download MACD with two lines on our website.
To learn about the best MACD settings, visit our page.

MACD is a short form for Moving Average Convergence Divergence; the MACD chart displays two different shifting averages and is crafted to run along with the centerline. When set to a standard model, it shows a 12-period exponential moving average and 26-period exponential moving average. It just depends upon your preferred trading timeframe. If you like to do trading according to the daily chart, then standard mode functions.
The best MACD settings are the standard ones, and it would be infrequent when you’d need to change them. The measuring parameter is momentum, and the chart helps one visualize the price momentum at that moment, comparing both short and long-term price changes. Not only so, but there are specific points one must take care of upon using the MACD indicator:
A singular line in these charts is created based on the 9-period exponential moving average or a shorter period EMA, and this is one of the cases where standard settings aren’t used.
When a MACD chart is positive, the moving average of the short term is higher than a long time moving average. Thus, as per this display, upward momentum is visible.
Similarly, when the chart is on the negative side, the long-term moving average is higher than the short-term moving average. Thus, as per this arrangement, downward momentum is displayed.
When the market constantly goes up and down, one must change the settings to see the shorter period moving average to get the trading signals.
What is the RSI indicator?
RSI indicator or Relative Strenght Index represents momentum indicator that determines trend strength, overbought and oversold levels. RSI measures the speed and change of price movements, and its values range from 0 to 100.
RSI is also a momentum indicator like MACD, and investors mostly use it to identify the overbought and oversold conditions present in the market. By putting this indicator to use, one can determine whether the name of renowned security lives up to its mark or is just overhyped. The RSI stock charts are placed on a scale displaying values between 0 to 100. This is what it exactly signifies:
When the reading goes above 70, then that particular security is overbought by traders.
When the reading goes below 30, then that particular security is oversold amongst traders.
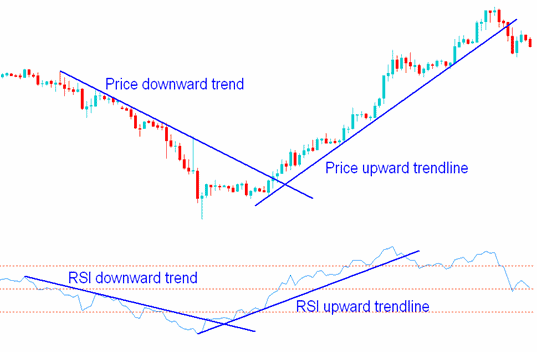
Several people also suggest that a reversal could occur when the actual price is drifting from the RSI signal. Technically, it is referred to like the term ‘divergence,’ and it is a handy tool for those who wish to identify the latest reversals in the trends. When the indicator’s settings are set to the standard mode, the chart is plotted with data of up to 14 trading periods.
Like MACD, even in RSI, the indicator identifies the statistics depending on the preferred trading timeframe. For example, if the trading takes place according to the daily chart, 14 days will be used. Just like that, when you trade according to the hourly chart, the data will be plotted per the 14 hours. Thus, the period of the RSI divergence can be set for the shorter term when the market is dynamic.
The RSI signals are displayed according to the latest price trends and reduce wrong signals visible in a shorter timeframe when the market is rapidly changing.
How to avoid RSI false signals?
To avoid RSI false signals, use default RSI settings and use RSI in higher time frames such as H4, Daily, or Weekly charts. Usually, RSI reacts very fast to solid price movements, and this can generate a false signal. The best way is to wait for H1 or H4, or Daily or weekly candle to close and check if momentum changed.
For example, the price moves very fast from 1.3 to 1.305 in just a few minutes. On the hourly chart, RSI shows a bullish trend, and the RSI value is above 60. However, 10 minutes before the hourly candle closes, the price is going down, and the RSI value is below 50. Therefore, as a trader, you need to wait hourly close before your trade position.
Can You Use RSI and MACD Together?
You can use RSI and MACD indicators together even though both indicators show a similar momentum change and usually give identical signals. However, if you decide to enter into a trade, if both indicators show a bullish trend or a bearish trend, you can decrease the number of false signals.
One indicator, in this case, will give different conformation of the momentum change, and you as a trader will have an additional trigger, fewer false signals, fewer trades, and better performance.
MACD vs. RSI
- RSI indicator shows trend change faster than MACD for the same time frame
- MACD has slightly better performance than RSI for short-time trades in M5, M15, M30, H1 time frames.
- MACD and RSI, and all other standard technical indicators do not predict future prices. They only remove noise in the time/price chart and visually present momentum change. They give the edge to traders.
Although MACD and RSI are highly compatible amongst traders, certain factors make them different and ideal for a specific use. There are a set of situations when the RSI has proven itself to be stronger, and the sides have split as well. Check these pointers out:
Researches prove that the MACD chart is quite capable of identifying probable trends of both small-cap and large-cap stocks, not the mid-cap stocks whose trend lines aren’t entirely clear. When looking at statistic-based situations, this particular indicator was found accurate nearly 80% of the time until the stock was from a small-cap or a large-cap sector. When taking a look according to the classifying standpoint, if a company crosses $10 Billion, then it is a large-cap.
A small-cap company has a market value under $1 Billion. This research assures that this indicator, in particular, is not well-functioning in non-categorized markets. Therefore, if you’re trading in a trending sector, then MACD is the perfect indicator for you, but if not, then RSI would be the way to go.
Whether trading daily, weekly or monthly, the MACD indicator can function in every timeframe. Not only that, but this indicator is easy to alter amongst two moving averages. For instance, in longer-trade signals, these hold the capacity to ease the short to medium-term volatility, which is very useful when you trade in an asset that is dynamic and everchanging when in the market.
It is so because long-term trading on a risky asset requires smoothening of signals to decrease the number of false alerts. In simpler terms, it refers to the period when someone wishes to clear the clutter and get a defined image of when to buy and sell the securities.
When it comes to short-term trade signals, volatile assets would require smaller period moving averages to get alerts based on the latest trends, ensuring you make decisions of trading based on the newest data acquired from the market.
When you are into short period trading, the MACD trading chart is a better and an ideal indicator to go for than RSI. But, a trader must always know that short-term trading is riskier in comparison to the regular cycle. For instance, selling the shares in a limited time frame involves the following steps:
Traders dealing in short-term shares need to borrow those from an investment firm.
Then, they sell it to another investor.
Furthermore, the trader repurchases the shares to return those to the investment firm, a.k.a the profit booking stage.
Lastly, the shares are returned to the firm from which they were once borrowed.
Now, all these steps indicate the number of issues in short-term trading, but if you frequently do it and have now understood the procedure, then the MACD indicator would be better than the RSI one in this case.
RSI proved to be more efficient and compatible with the overall amount of profit earned from trading with the help of the displayed signals and the increasing capital of every trade. It signifies the perfect time to buy or sell a particular form of security, resulting in a profit. Moreover, RSI trading offers effective outcomes when a person uses it for a more extended period.
RSI is slightly more reliable than MACD when used in markets that aren’t trending. This period is when the price diverts itself to the sideways, lying between the support and the resistance for a longer time. There is no such specific increasing or decreasing price of the asset; it is pretty stable.
Non-trending markets are quite a risker than the trending ones, but when you are a part of it and are constantly trading in the same, you will notice that RSI helps you get more precise outcomes than MACD. You should remember that studies might favor using this particular indicator for lesser trending markets, but you should conduct your analysis and make a final trading decision.
The Relative Strength Index indicator pairs well with fundamental analysis as the technique focus on the asset’s price, further comparing it to its outstanding value. In addition, RSI looks for upcoming differences in the price momentum to display the accurate time of purchasing or selling the shares. Using these two together certainly provides profit to a certain extent.
In Conclusion: Which of them is the best?
Several people have laid knowledge to a certain extent on both MACD and RSI indicators in all sorts of market situations. Both of them have displayed their benefits, therefore leaving it on the trader to use one according to their status. When MACD proves itself to be compatible in all situations, RSI rules specific complex trading scenarios.
But in both their cases, regardless of how compatible these are, your entire decision should never be based on these indicators. Rather than that, it would help if you always focused on the visual representation of indicators, cumulate additional triggers, and then enter the trading field. This step will help you make your decision stronger as it’s never wise to rely on just one’s insights!

He is an expert in financial niche, long-term trading, and weekly technical levels.
The primary field of Igor's research is the application of machine learning in algorithmic trading.
Education: Computer Engineering and Ph.D. in machine learning.
Igor regularly publishes trading-related videos on the Fxigor Youtube channel.
To contact Igor write on:
igor@forex.in.rs
Related posts:
- Download MACD 4C Indicator
- Best MACD Settings for Intraday Trading
- Download MACD 2 Line Indicator for MT4!
- MACD and Bollinger Bands Strategy – BB MACD Tutorial
- Download MACD Divergence Indicator MT4!
- MACD vs. RSI – Which Indicator Gives Better Trading Results?
- Awesome Oscillator and MACD Strategy! – Awesome Oscillator vs. MACD
- What is the Best Momentum Indicator?
- Types of Trend Indicators
- MBFX Timing Indicator – Free download MT4 Indicator
- What is Trix Indicator? – Download Trix Indicator for MT4
- Download SSL Channel Indicator For MT4!
