In the ever-evolving business landscape, finding a strategy that withstands the test of time and remains relevant and effective in the present day is tough. As businesses navigate the decades, they must grapple with shifting market dynamics, technological advancements, changing consumer preferences, and global economic fluctuations. This quest to discover a strategy that stands the test of time and remains pertinent in the contemporary world is a journey fraught with complexity and uncertainty but undeniably worth embarking upon. In this exploration, we delve into the formidable task of finding a strategy that not only worked in the past but continues to thrive in the present day.
So, my idea was that the strategy must be simple!
Please check my video with the whole explanation:


While aged in publication, older trading books often hold timeless wisdom that can still be applied successfully in today’s dynamic markets. In this chapter, we’ll embark on a journey to assess the relevance of strategies from four classic trading books:
1. “How to Make Money in Stocks” by William J. O’Neil (1988): Our mission here is to evaluate O’Neil’s celebrated CAN SLIM strategy, a fusion of technical and fundamental analysis. The goal is to understand whether its components, such as Current Earnings, Annual Earnings, and New Products, can be adapted to modern market conditions using contemporary data sources and tools.
2. “The Elliott Wave Principle” by Robert R. Prechter Jr. and A.J. Frost (1978): Delving into the complex realm of Elliott Wave Theory, this book provides insight into market cycles and price patterns. Our task is to assess whether this theory remains relevant in deciphering today’s market behavior or has evolved over the years.
3. “Technical Analysis Explained” by Martin J. Pring (1979): Martin Pring’s comprehensive guide to technical analysis offers a treasure trove of indicators and chart patterns. Our mission is to identify and extract those indicators and concepts that have stood the test of time and remain effective in modern trading.

4. “Charting and Technical Analysis” by Fred McAllen (1973): This book focuses on practical charting techniques and equips us with tools for analyzing price movements. We aim to scrutinize these techniques and determine their applicability in today’s trading landscape, considering advancements in charting software and tools.
To accomplish our goal, we’ll start by understanding the historical context in which these books were written. We’ll then study the core strategies presented, identifying elements that transcend specific historical market conditions. We will focus on concepts and indicators that withstand the test of time. Additionally, we’ll conduct backtesting with historical data to gauge the strategies’ performance in recent years.
It will also be invaluable to seek the insights of trading experts who have applied these strategies in contemporary markets. In doing so, we aim to synthesize the wisdom from these classic texts with modern tools, data sources, and risk management practices.
Remember that successful trading combines tradition and innovation as we unearth and adapt these time-tested strategies. While older strategies provide a solid foundation, they must be complemented with a deep understanding of today’s market dynamics. In the next chapter, we’ll explore the backtesting process and seek expert opinions to refine our strategies for the modern trading landscape.
Three Candles in The Row Strategy
The “3 Candles in a Row” Forex strategy is a relatively simple yet potentially effective approach that relies on recognizing patterns in consecutive candlesticks to make trading decisions. Here’s an explanation of this strategy:
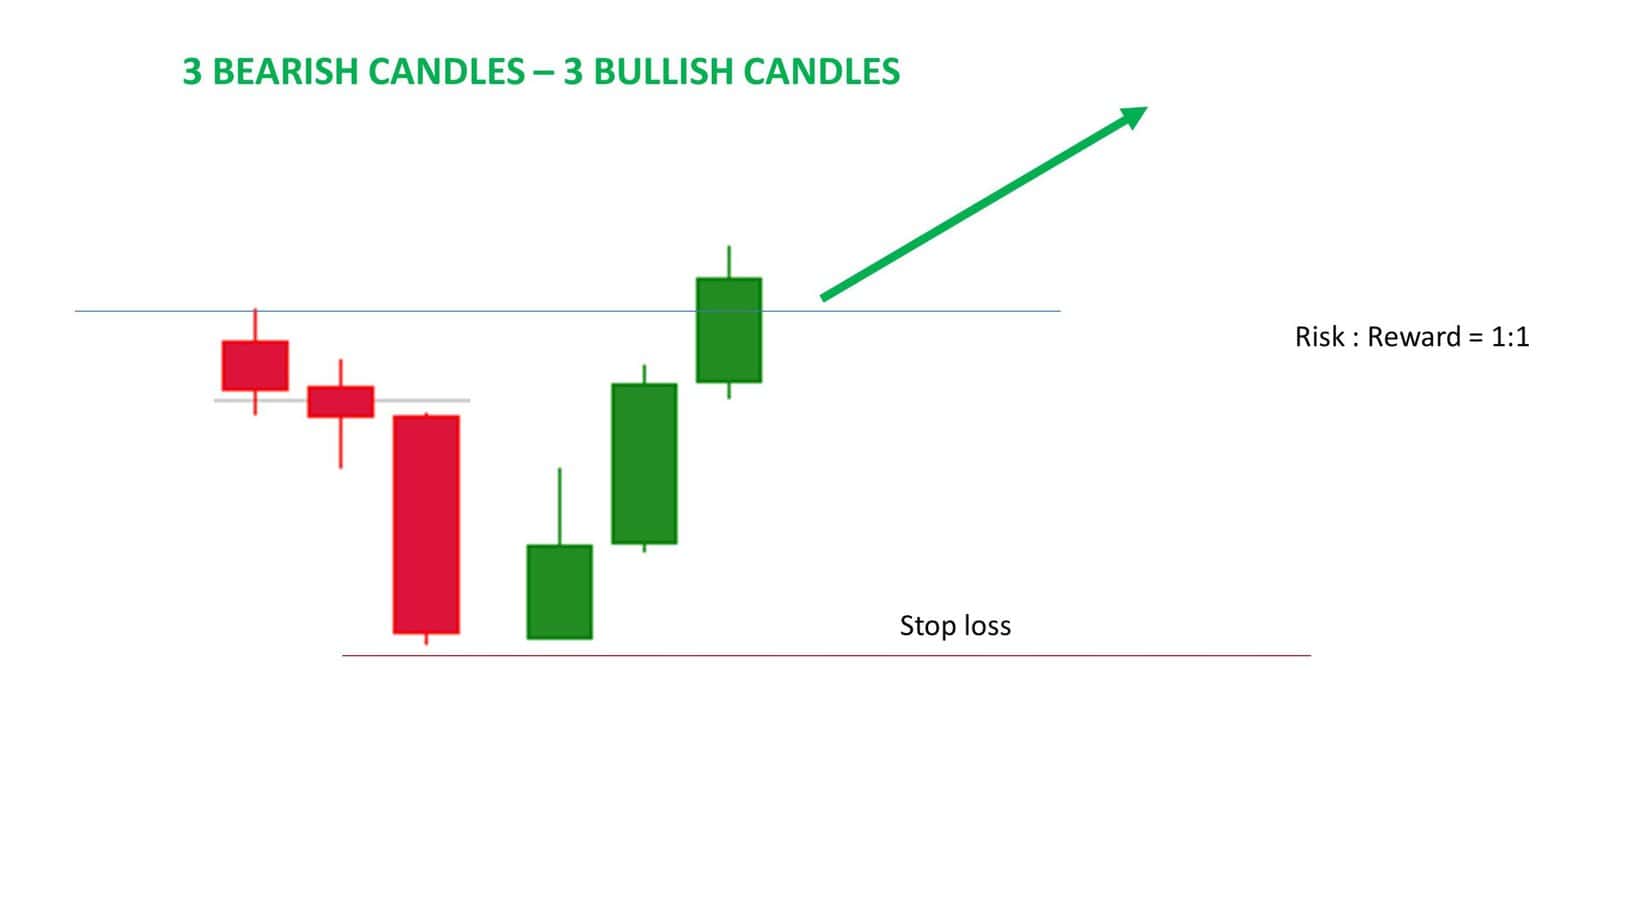
Buy Signal (Bullish):
- Identify 3 Bearish Candles: To trigger a buy signal, the first step is to observe three consecutive bearish (red or black) candles on the price chart. These candles indicate a period of downward price movement or selling pressure.
- Wait for 3 Bullish Candles: Following the three bearish candles, you should then wait for the next three consecutive bullish (green or white) candles to appear on the chart. These candles suggest a reversal of the previous downtrend, signaling potential upward momentum.
- Buy Entry: Once you see the third bullish candle closing higher than the first bearish candle, it confirms the reversal. This is your signal to enter a long (buy) trade, as it implies that bullish sentiment has likely taken over, and the price may continue to rise.
Sell Signal (Bearish):
- Identify 3 Bullish Candles: You’ll first look for three consecutive bullish candles on the price chart for a sell signal. These candles represent an uptrend or buying pressure.
- Wait for 3 Bearish Candles: After spotting the three bullish candles, you should watch for the next three consecutive bearish candles to develop. These candles indicate a potential reversal of the prior uptrend and a shift toward bearish sentiment. Once you see the third bearish candle closing lower than the first bullish candle, it confirms the entry signal.
- Sell Entry: When the third bearish candle closes lower than the preceding ones, it confirms a reversal of the previous uptrend. This is your signal to enter a short (sell) trade, as it suggests that bearish forces have gained control, and the price may continue to decline.
Testing results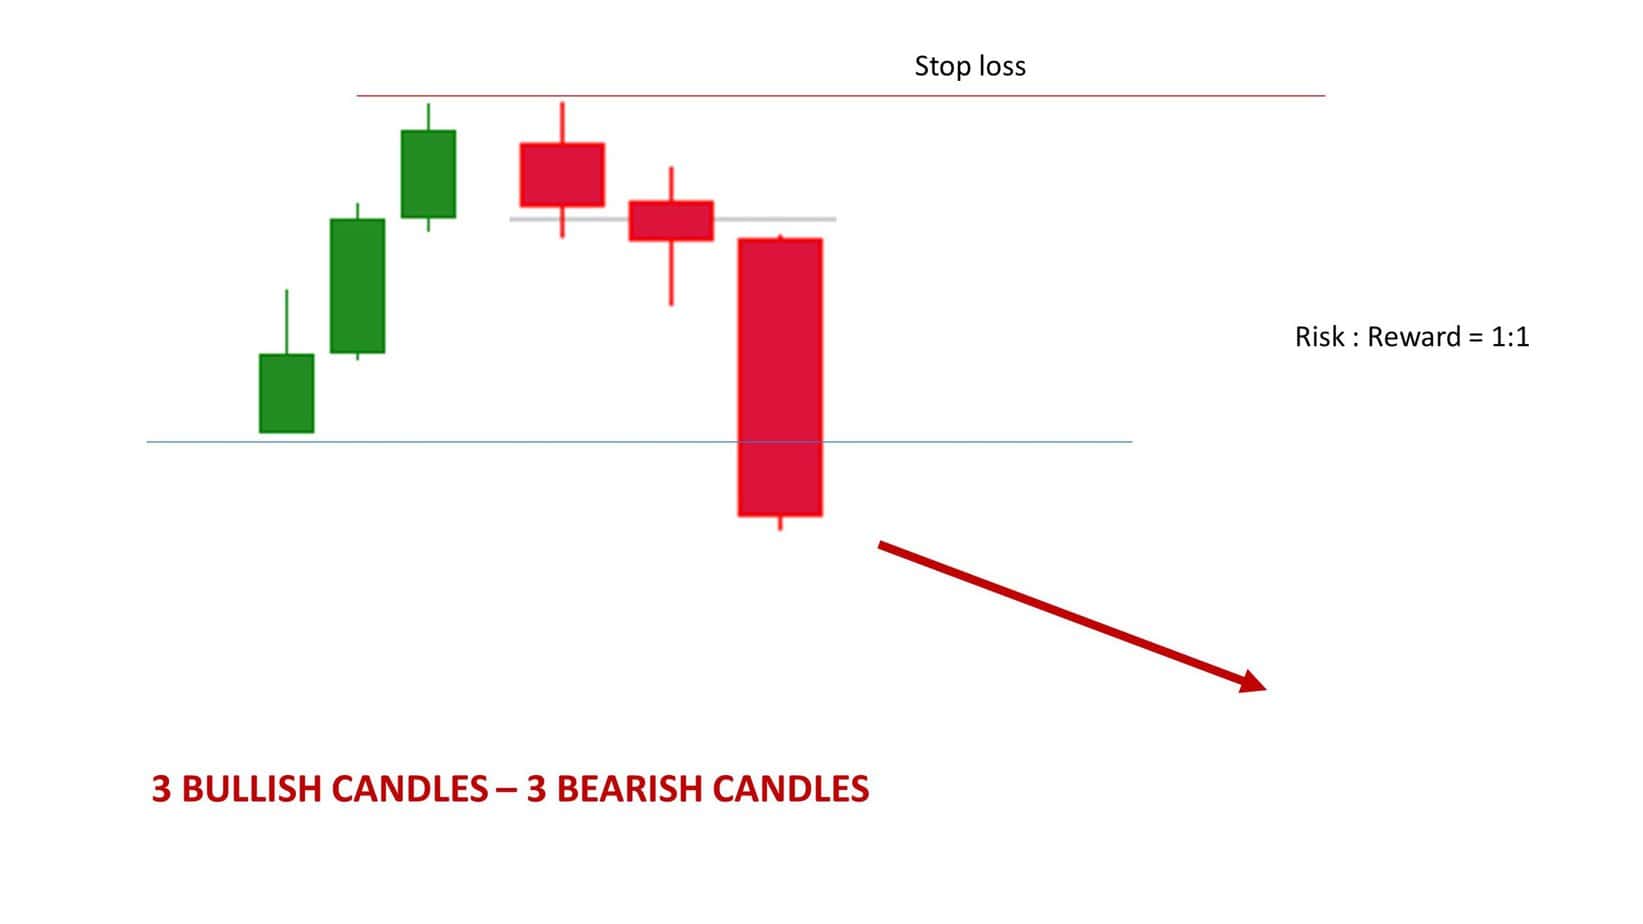
Testing Results
The EA operates on a fundamental premise: it initiates a single trade at a time, either a buy or a sell, using a consistent fixed lot size. Unlike many EAs that employ trailing stop losses and advanced risk management techniques, this EA relies solely on the market dynamics and the efficacy of its entry and exit points.
Perhaps one of the most striking aspects of this EA is its extraordinary consistency. Over the 24-year testing period, the EA generated a cumulative profit of $3,416. Even more noteworthy is its ability to maintain a low drawdown, implying that it seldom experiences significant losses or consecutive losing trades.
Please check the testing results from MT4 in the screenshot below:
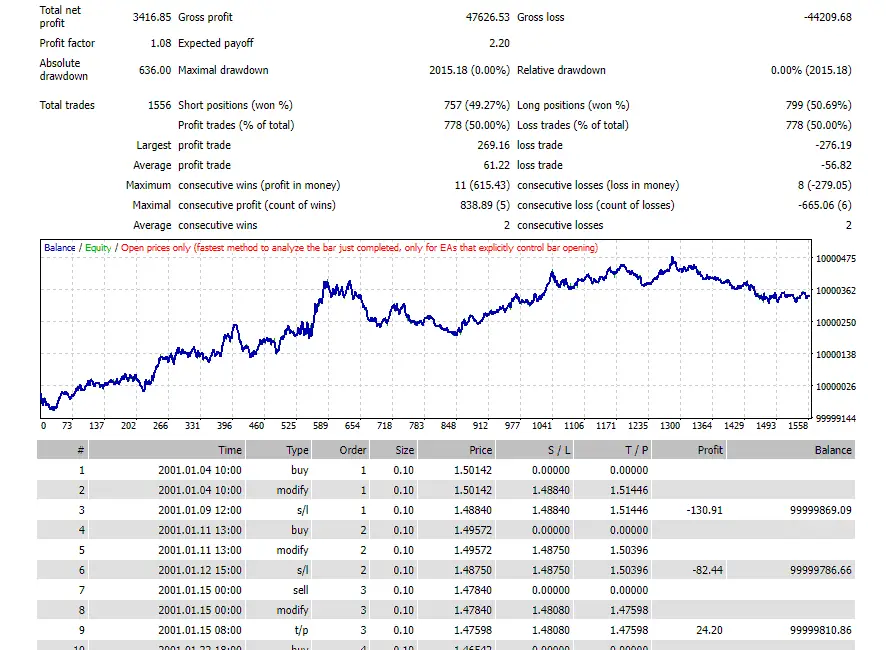
An intriguing facet of this EA is its capacity to string together up to 11 consecutive winning trades during testing. This remarkable winning streak underscores the robustness of the trading strategy underpinning the EA.
This case study is even more fascinating because every year within the 24-year timeframe has been profitable. This consistency across various market conditions reinforces the effectiveness of the EA’s straightforward, single-rule-based approach.
This EA reduces overhead and streamlines its operations by eschewing the complexities of trailing stop losses and intricate risk management mechanisms. This simplicity has played a pivotal role in its success.
- Basic EA Configuration: The EA is configured with a straightforward set of rules. It initiates a single trade at a time, either a buy or a sell, with a fixed lot size.
- No Trailing Stop Loss: Unlike more complex EAs, this one doesn’t incorporate a trailing stop loss. Instead, it relies solely on the market dynamics and entry points to determine when to close a trade.
- Fixed Lot Size: The EA uses a fixed lot size for every trade, meaning the position size remains constant, regardless of the account balance or trade outcome.
- Remarkable Consistency: This EA has consistently performed well over 24 years. During this period, it generated a total profit of $3,416 (if you think this is nothing special, remember there isis only 1 rule in the the trading system without any optimization).
- Low Drawdown: One of the most noteworthy aspects of this EA is its ability to maintain a low drawdown. This implies that it rarely experiences significant losses or consecutive losing trades.
- Consecutive Winning Trades: The EA’s simplicity has led to a surprising outcome – it has experienced up to 11 consecutive winning trades in a row during testing. This remarkable winning streak suggests a robust trading strategy.
- Annual Profitability: What’s particularly intriguing is that each year within the 24-year testing period has been profitable. This consistency reinforces the effectiveness of the EA’s single rule-based approach.
- Lack of Overhead: By excluding complex risk management and trailing stop loss mechanisms, the EA reduces overhead and eliminates potential complexities that can sometimes hinder performance.
- Market Analysis: The EA likely employs a specific market analysis method, such as technical or fundamental analysis, to identify entry and exit points for trades.
- Adaptive Simplicity: While the EA’s simplicity is its strength, it’s important to note that market conditions can change. Traders should remain vigilant and be prepared to adapt or fine-tune the strategy to ensure continued success.
Conclusion
the case study of the simple Expert Advisor (EA) highlighted the power of simplicity in trading. This EA, devoid of complex risk management and trailing stop loss mechanisms, achieved impressive results over a 24-year testing period. Its ability to maintain profitability each year, coupled with a low drawdown and notable winning streaks, underscores the efficacy of its single-rule-based approach. While this EA serves as a testament to the potential benefits of straightforward trading strategies, traders should always exercise caution, conduct thorough testing, and remain adaptable to changing market dynamics.

He is an expert in financial niche, long-term trading, and weekly technical levels.
The primary field of Igor's research is the application of machine learning in algorithmic trading.
Education: Computer Engineering and Ph.D. in machine learning.
Igor regularly publishes trading-related videos on the Fxigor Youtube channel.
To contact Igor write on:
igor@forex.in.rs
