Table of Contents
John Carter from Trade the Markets (now known as Simple Trading) created TTM Squeeze, a momentum and volatility indicator that takes advantage of the price’s tendency to change violently after combining in a narrow trading range.
What is the TTM Squeeze indicator?
A TTM Squeeze represents a trading indicator based on a volatility measure that uses Keltner Channels and Bollinger Bands to gauge price compression. Squeeze implies a moment when the Keltner Channels entirely encircle Bollinger Bands during extremely low volatility. TTM squeeze indicator alerts traders when markets may break out of a consolidation range.


What does TTM squeeze stand for
In the TTM squeeze name, TTM represents an abbreviation from Trade The Market (former John Carter website). At the same time, Squeeze implies a moment when the Keltner Channels entirely encircle Bollinger Bands during extremely low volatility.
- The TTM Squeeze indicator is a technical analysis indicator that identifies periods of low volatility in the markets followed by periods of high volatility.
- The indicator is based on Bollinger Bands and Keltner Channels; two technical analysis tools used to measure price volatility.
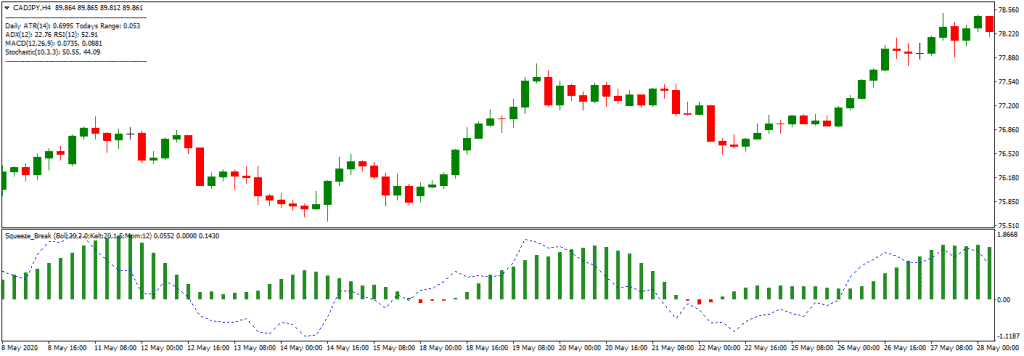
- The TTM Squeeze indicator plots two histograms, one for volatility and one for momentum, and a dotted line representing the squeeze.
- The squeeze occurs when the Bollinger Bands are inside the Keltner Channels, indicating a period of low volatility.
- The histogram for volatility is blue during the squeeze period, indicating that volatility is contracting.
- The histogram for momentum is gray during the squeeze period, indicating that momentum is also contracting.
- When the squeeze is released, the Bollinger Bands expand outside the Keltner Channels, indicating a period of high volatility.
- The histogram for volatility turns red during the release period, indicating that volatility is expanding.
- The histogram for momentum turns green during the release period, indicating that momentum is also increasing.
- Traders use the TTM Squeeze indicator to identify potential trading opportunities during periods of low volatility and to avoid entering trades during periods of high volatility.
- The TTM Squeeze indicator can be used for multiple time frames, such as intraday, daily, and weekly charts.
- It’s important to note that no indicator is 100% accurate, and traders should always use multiple indicators and conduct proper risk management when making trading decisions.
How to use the TTM Squeeze indicator?
TTM squeeze indicator you can use as an excellent signal for a pullback. A BUY order can be made if the overall trend is bullish and the histogram is green. A SELL order can be made if the general trend is bearish and the histogram is red.
The squeeze is considered to have “fired” when the Bollinger Bands move back and enlarge outdoors of the Keltner Channel; prices are probable to break out of that close-fitting trading choice in one path or the other as volatility rises. Minor points on the zero lines of the pointer indicate whether the squeeze is on or off: red dots show that the congestion is on, and green dots show that the congestion is off.

When the TTM Squeeze pointer fires, it also utilizes a motion oscillator to display the expected path of the move. This histogram wavers near the zero lines; rising momentum beyond the zero lines indicates a buying opportunity, while decreasing momentum under the zero lines indicates a selling opportunity.
Squeeze indicator MT4 download
How Can You Calculate TTM Squeeze?
The squeeze on and off dots and the motion histogram are the two modules of the TTM Squeeze pointers to compute.
Calculate the Bollinger Bands on behalf of security first. Carter utilizes the standard Bollinger Band sets of 2 common aberrations and 20 periods, but you can change these to suit your trading requirements.
Second, determine the security’s Keltner Channels. Although these values can be changed, Carter utilizes a 20-period moving average, ATR, and a 1.5-period ATR multiplier.
Note: Carter calculated the Keltner Channels for the TTM Squeeze indicator using the unique Keltner Channels method established in 1960 by Chester W. Keltner. The modified Keltner Channels model was created in 1980 by Linda Raschke.
The formula for identifying the squeeze condition is easy once the lower and upper Keltner Channels and Bollinger Bands have been computed. Then, the squeeze is on for that period if both of the following situations are true:
- Upper Bollinger Band < Upper Keltner Channel
- Lower Bollinger Band > Lower Keltner Channel
If one or the other Bollinger Bands trades outside of the Keltner Channel, the squeeze is off for a time.
Momentum Histogram
A curved momentum oscillator is also included in the TTM Squeeze indicator to highlight the breakout’s likely direction. The momentum oscillator is created using the methods below in StockCharts’ enactment of TTM Squeeze.
Analyze the Donchian midline for the total offer amount of momentum time (default is 20):
(lowest low in 20 periods + Highest high in 20 periods ) / 2
Second, calculate the SMA of the closing (by evasion, a 20-time SMA of rates) for the total momentum time.
Third, using the formula below, calculate the outlet between the average and close of a Donchian SMA and midline values:
Close – ( (Donchian midline + SMA) / 2 )
Finally, smooth the delta price using linear regression. Although the method for linear reversion is outside the choice of this essay, it effectively seeks out the “best fit” line given the feasible information. The values of the motion histogram indicate how much below or above the average the deal is likely to move.
Interpretation – Understanding TTM squeeze
TTM squeeze indicator alerts traders when markets may break out of a consolidation range and show the best moment to enter buy or sell positions. On the chart, this moment represents the moment when the Keltner Channels entirely encircle Bollinger Bands during extremely low volatility.
Both momentum and volatility are included in a TTM Squeeze indicator. The Squeeze dots show when volatility circumstances are favorable for buying; the motion histogram suggests whether to trade long or short.
The motion histogram aids in determining which direction to trade. If the momentum is beyond and rising the zero lines (light blue slabs), purchase long; if the momentum is falling and short under the zero lines (dark red bars).
The motion bars are color-coded to make them easier to understand. For example, blue bars appear beyond zero lines, whereas red bars appear under zero. A poorer bar than the preceding bar is a darker color (darker red or darker blue ), while a more advanced bar than the prior bar is a lighter color (lighter red or light blue).
Later a squeeze fires. Price swings usually last 8-10 bars. Once the histogram reverses its orientation and begins to fall rear toward the zero lines, it’s time to sell.
The motion histogram can be utilized to pinpoint specific exit sites as well. For example, when you have two bars of the latest color, Carter suggests selling them. If a squeeze occurs and the bars are blue (increasing and above the zero lines), he sells when two brighter blue bars (above the zero lines and decreasing) appear in succession.
The TTM Squeeze pointers apply to a wide range of timeframes. As a result, many characteristics appear at the same safety in different time frames for validation. For example, a squeeze that fires on an hourly and daily chart simultaneously is a stronger signal than one that fires on one period.
Conclusion
The TTM Squeeze pointer tracks momentum and volatility to identify trade opportunities based on security volatility changes. After times of low volatility, the indicator’s volatility component (the squeeze dots) predicts potential breakouts. The motion histogram indicates the breakout’s anticipated direction, which can aid in determining exit spots.
Traders should utilize the TTM Squeeze pointer with further analysis and indicators methodologies, as they should with all indicators.
The indicator defaults to basic original Keltner Channel and Bollinger Band settings and a 20-time motion histogram. Still, you can change the number of other and period locations to suit your technical needs.

He is an expert in financial niche, long-term trading, and weekly technical levels.
The primary field of Igor's research is the application of machine learning in algorithmic trading.
Education: Computer Engineering and Ph.D. in machine learning.
Igor regularly publishes trading-related videos on the Fxigor Youtube channel.
To contact Igor write on:
igor@forex.in.rs
Related posts:
- Traders Dynamic Index Indicator – Download TDI Indicator
- Download ADX Histogram Indicator
- Download MACD 2 Line Indicator for MT4!
- Vertex Mod Indicator – Free Download Vertex Mod No Repaint Indicator
- MBFX Timing Indicator – Free download MT4 Indicator
- Download MACD 4C Indicator
- Keltner Channel vs. Bollinger Bands Indicator
- Download VWAP Indicator for MT4
- Download QQE Indicator! How to use QQE Indicator?
- Download Market Profile Indicator
- Chaikin Volatility Bands Indicator – Free Download Chaikin Volatility Indicator
- Download SSL Channel Indicator For MT4!
