Table of Contents
Technical indicators like Keltner Channels and Bollinger Bands are used in technical analysis to measure the price volatility of an asset. The two indicators can be used to spot the buying and selling opportunities in the market, but which is more effective?
Keltner Channels vs. Bollinger Bands
The Bollinger Bands Indicator is more used than the Keltner Channels Indicator. Bollinger Bands indicator is more sensitive to market volatility and has wider bands than Keltner Channel, so it shows the best performance in a bullish and bearish volatile market. However, Keltner Channels Indicator performs better during the range market because it offers lower sensitivity, less frequent trades, and a narrower channel.


Technical analysis does not have a single indicator that can be employed in all trading settings or for all trading reasons, as you may be aware. As a result, the technical signal you use in your trading strategy will be dictated mainly by the specific insights you want. Depending on your requirements, you may find Bollinger Bands preferable to Keltner Channels and vice versa.
The Keltner Channels and the Bollinger Bands differ significantly on a high level:
- The Keltner Channel’s outer lines are based on price variations’ average true range (ATR). On the other hand, the Bollinger Bands Indicator’s outer lines are based on the standard deviation of price changes.
- The Keltner Channel Indicator’s middle line is based on an exponential moving average (EMA). On the other hand, the Bollinger Bands Indicator’s middle line is based on a simple moving average (SMA).
- Bollinger Bands can also identify reversal trading opportunities, particularly when the price fails to reach the outer bands after a trending period and subsequently reverses to the opposite side of the bands.
- When the price can reach the outer bands, the Keltner Channel, like the Bollinger Bands, suggests a strong trending market. This indication confirms that the current price movement is longer than before.
- Like Bollinger Bands, Keltner Channels signals are delivered when the cost activity breaks above or beneath the channel groups. Here, be that as it may, as the cost activity breaks above or beneath the top and base hindrances, a continuation is preferred over a retracement back to the middle of the inverse boundary.
As I said, a significant difference is that Bollinger Bands respond more quickly to changes in market conditions than Keltner Channels. For example, suppose prices drop suddenly during a period of low volatility. In that case, Bollinger Bands will tighten more quickly than Keltner Channels since they rely on standard deviations rather than averages for their calculations. Additionally, there are some situations where markets tend to form channel-like patterns with prices oscillating within relatively narrow ranges for extended periods. In such cases, the channels formed by Bollinger Bands will remain relatively stable over time, while those started by Keltner Channels will likely shift significantly from one period to another due to volatility levels. Finally, traders should be aware that some charting software may have limitations when displaying multiple indicators with overlapping signals simultaneously on their charts. In such cases, it can often be easier and more effective to focus on one type of indicator instead of trying to use both at once.
The indicators are notably distinct, and establishing a consistent relationship may be difficult. When the market is trending, it may be believed that the Bollinger Bands tend to encompass the Keltner Channels, and vice versa when the market is flat because of the higher volatility of the standard deviation. Because of the inherent variances in volatility measurement, both indicators are likely to provide various trading profiles.

Important: One technical indicator is not superior to another; it could be a matter of personal preference based on which works best for the methods being used. However, highly advised to nearly never base trading decisions on signals from a single indicator. Including a variety of complementing indicators in your trading strategy can provide a better understanding of market psychology and, as a result, better trading results.
Research on the usage of Bollinger Bands in the Baltic Stock Market released by Kaunas University of Technology in 2010 made a similar recommendation based on a series of statistical tests. Several complementing indications can help you get a better picture of the market condition and assist you time your buying and selling decisions.
Furthermore, let us see a few instances where the Bollinger Bands show a better indicator than the Keltner Channels and vice versa.
Before we get into the best-used instances for each indicator, it would be essential to understand what the indicators do and how they are determined.
What is the Keltner Channels indicator?
The Keltner Channel is a technical indicator that is used in trading to measure volatility in the market. It was developed by Chester Keltner, a technical analyst, and trader who published a book on the subject in 1960. The Keltner Channel uses an exponential moving average to calculate price extremes, with upper and lower bands calculated based on this moving average. By definition, when prices move outside of these bands, this can indicate that the market has entered into a period of higher or lower volatility.
Please download the Keltner Channel indicator.
The Keltner Channel could be a specialized chart indicator that screens the cost instability of an asset over an indicated period. Chester Keltner presented Keltner Channels within the 1960s, but Linda Bradford Raschke upgraded the indicator within the 1980s. This aftermath adaptation of the Keltner Channels indicator is the one utilized nowadays. Keltner Channels combines two pointers: the exponential moving average (EMA) and the average genuine run (ATR). The moving average may be the average cost for several periods. However, the exponential variation gives a more significant weighting to later prices and a lesser weighting to fees that aren’t like the later prices.
Keltner Channels are valuable since it makes a trend more effortlessly unmistakable. When a resource is trending higher, its cost ought to routinely reach or come near the upper band and now and then sometimes move past it. The price should remain over the lower band and regularly stay over the middle or barely dip below it.
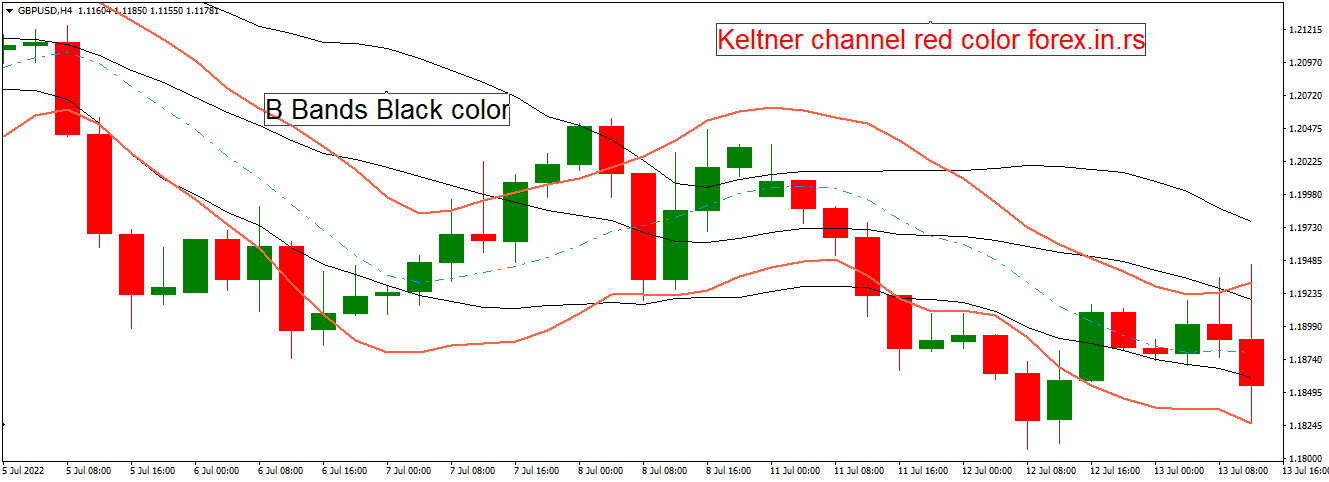
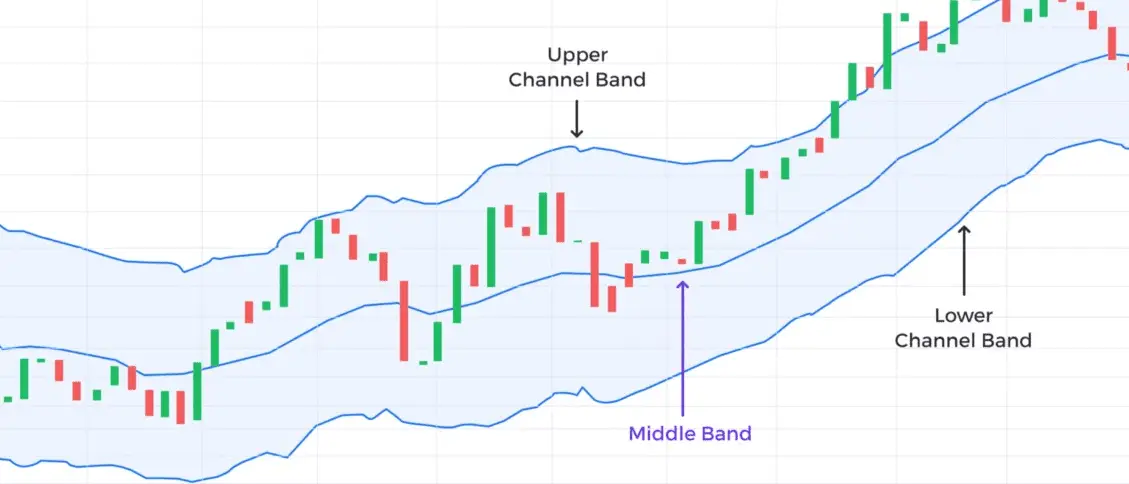
Three lines make up the Keltner Channel indicator:
Middle Line
- The Keltner Channel Indicator’s middle line calculates and displays the exponential moving average (EMA) for the given time for the asset’s price.
- The exponential moving average (EMA) can be keener to recent price movements than a simple moving average because of its constraint toward recent price changes.
Upper Line
- The Keltner Channel’s upper line attaches price points above the EMA or the Middle Line, double the accurate average range.
Lower line
- The Keltner Channel’s lower line attaches price points below the EMA or the middle line, double the accurate average range.
The word “Keltner Channel” alludes to the structure shaped by the three lines shown above, which builds up when plotted on an asset’s price chart. The three lines go up and down the y-axis, displaying the security price. This movement is like a river, with the upper and lower lines taking after the river bank.
When the exponential moving average (EMA) or the channel’s middle line moves outside the confinement of the channel (the upper or lower Line), this movement might be seen as a signal for an impending change or acceleration in the trend’s direction.
It recently utilized Keltner Channels to exchange with genuine cash and hone trading on the indicator’s signals in a demo account. Hone chooses which trades may be needed and which to dodge.
What are the Bollinger Bands?
John Bollinger also developed the Bollinger Bands indicator, it uses standard deviations to calculate price extremes instead of an exponential moving average. This makes it similar to the Keltner Channel in some ways, but there are also significant differences between these two indicators. One key difference is that Bollinger Bands use a fixed percentage difference between the upper and lower band levels, while Keltner Channels vary depending on recent volatility. Bollinger Bands typically produce more frequent signals than Keltner Channels since they vary less in their calculations.
Bollinger Bands are a powerful method for detecting a change in market volatility by combining moving averages and standard deviations. Bollinger Bands Indicator is a widely used volatility indicator in technical analysis and was created and trademarked by John Bollinger, a well-known technical trader, to help investors spot possibilities that give a better chance of correctly detecting an asset oversold or overbought. The trader determines how many standard deviations the volatility indicator should be set. The number of standard deviations determines the distance between the middle band and the upper and lower bands.
The location of these bands indicates the strength of the trend and the potential high and low price levels to be expected soon. At first glance, Bollinger Bands and Keltner Channels appear the same. The Bollinger Bands Indicator, like the Keltner Channels Indicator, has three lines. This can be a specific application of the broader volatility channel concept.
Lines are drawn above and below a central price measure in a volatility channel. The lines, sometimes known as envelopes or bands, spread in response to market volatility. Bollinger Bands standard market volatility and provides lots of helpful information:
- Trend continuation or reversal
- Periods of market consolidation
- Periods of upcoming extensive volatility breakouts
- Possible market tops or bottoms and potential price targets
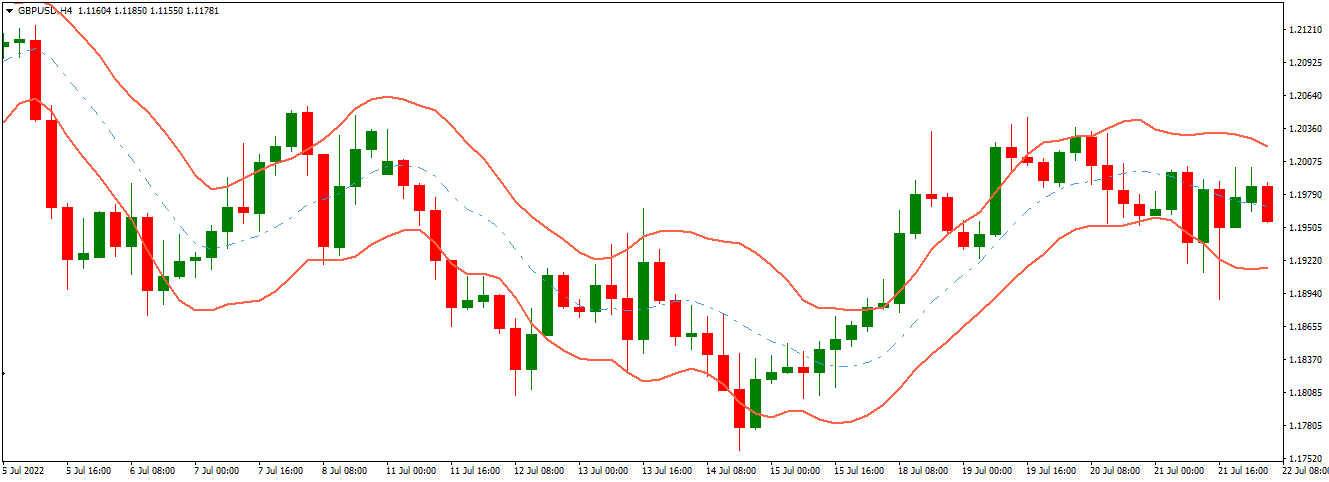
The Bollinger Bands Indicator is made up of three lines listed below:
Middle Line:
- The Bollinger Bands Indicator’s middle line calculates and displays the simple moving average (SMA) for the price of an asset over the indicator’s selected term.
- A simple moving average (SMA), unlike the exponential moving average (EMA), is not constrained by recent price fluctuations. As a result, SMA is less vulnerable to recent price movements.
Upper Line:
- The Bollinger Bands Indicator’s upper line attaches price points that are two standard deviations above the simple moving average, represented by the middle line.
Lower Line:
- The Bollinger Bands Indicator’s lower line attaches price points that are two standard deviations below the simple moving average, represented by the middle line.

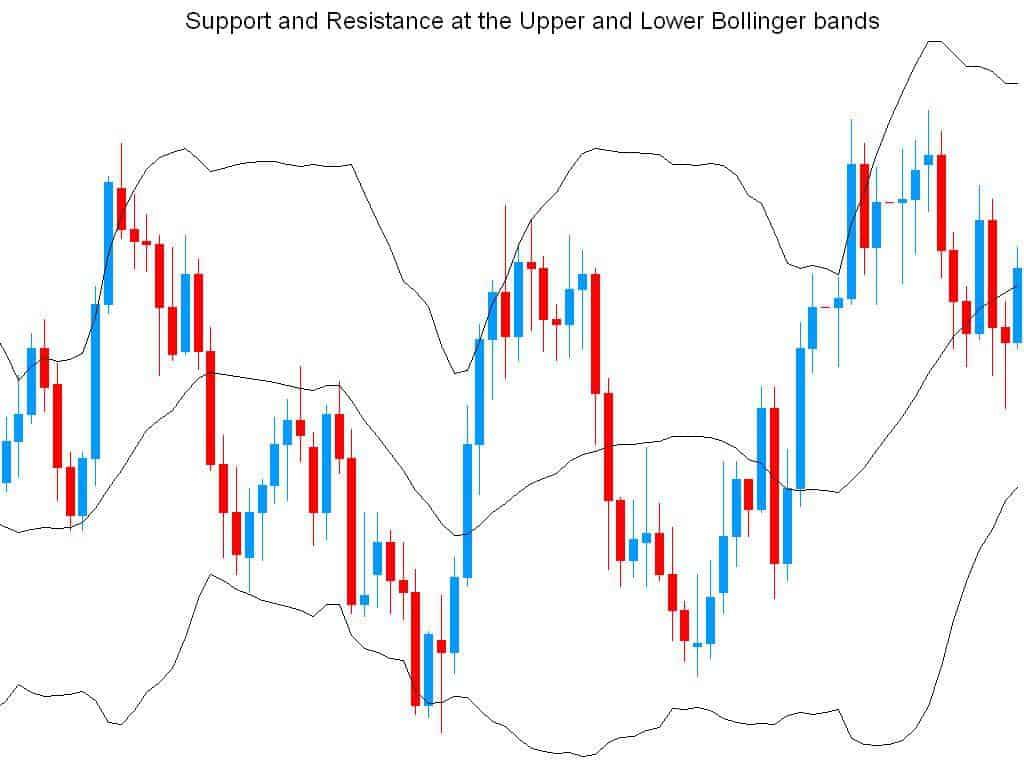
Bollinger Bands may adjust dynamically to price expansion and contraction as volatility rises and falls. As a result, the bands widen and narrow in lockstep with price movement, which may result in a highly accurate trending envelope. Because standard deviation is a measure of volatility, the bands widen as the markets get more volatile, while the bands contract as the markets become less volatile. Many traders may feel that as prices approach the top band, the market becomes more overbought, and as prices come to the lower band, the market becomes more oversold.
If the upper and lower lines of the indicator become apart, resulting in a Bollinger Band expansion, market volatility increases. If the upper and lower lines of the indicator become closer, resulting in the Bollinger Band contraction, market volatility decreases.
Difference between ATR and Standard Deviation
The Keltner Channel is based on the Average True Range, whereas the Bollinger Bands® use the standard deviation to calculate the width of the channel. The significant difference between these two indicators is that the ATR shows more fluctuations over a short-term period and indicates changes in market conditions less frequently than the standard deviation. In general, however, both indicators can be used for different purposes, depending on your goal. For instance, traders often use the ATR to spot support and resistance areas or determine market volatility. On top of that, many trading strategies are based on technical indicators that measure these two characteristics. The Bollinger Band® width can also be used for such purposes but is also an excellent tool for identifying potential breakouts and reversals. Traders might also want to consider using both indicators in combination by looking at different time frames – e.g., 15-minute charts and daily charts – or by applying them only to specifically chosen securities. Overall, which indicator you select depends entirely on what you try to achieve with your strategy or if you want an additional tool that offers extra guidance when making trading decisions.
Can Bollinger Bands Be Better at Analyzing Short-Term Trends
Compared to Keltner Channels, Bollinger Bands may respond faster to short-term or recent market swings. As a result, the Bollinger Bands may have been the best indicator for making trading decisions based on short-term price variations in several past studies.
The Bollinger Bands can be used in two different ways to assess short-term price movements:
- One might get a good notion of the price trend’s momentum by looking at where the security price is concerning the upper and lower lines of the Bollinger Bands indicator.
- Bollinger Bands that are too broad may indicate a new trend. When the space between the upper and lower bands begins to narrow, one should expect significant changes in the direction.
However, no general response to the outcomes of this indicator. A few investors may try to buy stocks when the price falls below the lower band and sell when the price rises above the moving average. Others may buy if the price increases over the upper band and sell if it falls below the lower band.
Using Bollinger Bands signals may entirely depend on your general trading strategy.
Why Bollinger Bands Indicator Provides Better Read on Market Volatility?
The Bollinger Bands can be more sensitive to market volatility than others. In a high-volatility market, a trader may miss multiple trading signals if the trader uses the Keltner channel. According to much research, Bollinger Bands may be frequently utilized by investors trying to sell options. Options traders search for occasions when the Bollinger Bands Indicator’s upper and lower bands are much apart for a short period. Because the volatility is high, this implies that that may be a good moment to sell an option.
When the upper and lower bands of the Bollinger bands are close enough, options traders employing volatility measurement as a critical trading signal are more likely to buy options. Options traders use this method to profit when price volatility returns to average levels.
Most are beneficial, just like any other technical indicator. However, it may not turn one into a billionaire day trader or help a trader predict market direction. But, it is beneficial for recognizing volatility spikes and determining whether markets are due for a pullback based on just price. Whether good or negative is entirely dependent on the trader. Some traders prefer Bollinger bands, while others do not.
Bollinger Bands may be used differently by different traders. A few traders may buy the stock when it reaches the lower Bollinger Band and sells when it reaches the middle Bollinger Band’s moving average. Some traders may buy when the price rises over the higher Bollinger Band, while others sell when the price falls below the lower Bollinger Band. Bollinger Bands aren’t just for stock traders or options traders; Bollinger Bands may be used to sell or buy options regularly.
When the bands are close together, this indicates a period of little volatility. On the other hand, the expansion of the bands may show a rise in market volatility. When the bands have only a minor slope and track almost parallel for an extended period, the price may bounce between as if in a channel.
Why Keltner Channels Provide More Reliable Trading Signals for Long-term Trading in High Volatility Markets?
Bollinger Bands’ outer bands are based on standard deviation rather than accurate average range and may be more volatile than Keltner channels. As a result, Keltner Channels could be less likely to generate a misleading trade signal in a high-volatility market situation for longer-term trading.
Keltner Channels can help highlight a pattern. When an asset is trending higher, the price should regularly reach or approach the upper band and occasionally move past the upper band. The price may also stay above the lower band and frequently remain above or rarely dip below the middle band.
In a high-volatility market setting, numerous studies, including one published by MQL5, may have statistically evaluated this notion and showed Keltner Channels vary less frequently than Bollinger Bands. As a result, as previously indicated, Bollinger Bands have a more significant potential for providing misleading signals than Keltner Channels.
Many traders in the energy markets favor Keltner Channels over Bollinger Bands, which are recognized for being more volatile.
Can Bollinger Bands Be Better to Find Overbought and Oversold Securities?
When the upper and lower boundaries are crossed, Bollinger Bands function best to signal the start of a trend. When the price of an asset rises above the upper band, it is termed overbought, and when it falls below the lower band, it is deemed oversold. Bollinger Band is one of the fascinating technical indicators utilized by practically all traders since it can gauge an ongoing trend, detect oversold levels, and indicate trend reversals.
A group of scholars from Manonmaniam Sundaranar University published a study in 2010 that evaluated the usefulness of several data mining approaches in projecting future stock market performance. In this study, Bollinger Bands are pretty helpful in recognizing overbought and oversold levels in the stock market.
With this statistical proof, it may be safe to argue that while looking for Overbought and Oversold instances in the market, you should use the Bollinger Bands Indicator rather than the Keltner Channels Indicator because many investors use Bollinger Bands to determine when an index is overbought or oversold. However, it’s critical to understand what causes to expand and contract. However, this method is far from flawless. So, what’s the technique?
Investors may consider an index overbought when it moves above the top band of the Bollinger Bands. An index may be termed oversold if it goes below the bottom range. The issue is that an index might remain overbought or oversold for an extended period. Excessive buying of securities has pushed trading prices so high that they may be expected to fall soon under overbought conditions. The Bollinger bands indicator detects overbought conditions when prices approach or exceed the indicator’s upper band.
Excessive selling of an asset has brought the trading price so low that it is expected to rebound to a higher level soon under oversold conditions. The Bollinger Bands Indicator may detect oversold conditions as prices approach and fall below the indicator’s lower band.
What’s the bottom line? Keep the breadth of the Bollinger Bands in mind when using it to gauge overbought and oversold circumstances. When the bands are broadening, one may avoid looking for overbought or oversold instances. Looking for these conditions might prove helpful when the bands are stable or even contracting.
Why Both Bollinger Bands and Keltner Channels Should Not Be Used in Isolation
If you are familiar with any past articles on trading, you may understand the emphasis on the need not to put all your eggs in one basket. Regardless of which indicator or idea you use, a trader may always use other confirmation signals to get the best outcomes.
However, it may be noteworthy to utilize the findings of another intriguing study to emphasize this point and its importance.
A paper titled: “The Profitability of Technical Trading Rules: A Combined Signal Approach” was published in the Journal of Applied Business Research in 2007 by Lakehead University’s Camillo Lento and Nikola Gradojevic.
In the paper, Lento and Gradojevic investigated the efficiency of producing profitable trades for numerous technical indicators and, more crucial technical analysis principles. According to the findings, the Bollinger Bands Indicator may not be more beneficial than a naive buy-and-hold method unless used with other complementing approaches to trade analysis. Other technical indicators included in the study, such as the Moving Average Crossover Rule, Head and Shoulders Pattern, Range Breakouts, and so on, yielded similar results.
Conclusion
Bollinger Bands and Keltner Channels are technical indicators used to determine how volatile an asset’s price is. Technical traders from all markets (stocks, forex, cryptocurrencies, and so on) are known to use these indicators as part of their entire trading strategy. They may be among the most often used indicators in technical analysis.
Several statistical studies and research papers have been produced in recent years to better understand the efficiency of each of these indicators in various market settings. By combining the outcomes of the studies, it can be stated that both indicators have their own merits. An optimum indicator choice may vary based on your trading purpose and market conditions. The Bollinger Bands would be used in some trading circumstances, while the Keltner Channels would be used in others.
That said, you should always treat the signals from technical indicators as only one part of your total trading strategy. Making trading decisions based only on one indicator may never be wise.
Some key takeaways:
- The Keltner Channel may be slower than other indicators, like Bollinger Bands, at detecting volatility. You may need to tweak your Keltner Channel settings if you trade various assets. The settings you use on one asset may not function or be the optimum settings for another.
- Bollinger Bands are a trading tool that can help a trader figure out where to enter and exit a transaction. Overbought and oversold scenarios are commonly identified using the bands.
- Trading exclusively with the bands may be dangerous because the indicator focuses on price and volatility while disregarding other essential data.
- Investors should pay attention to how the upper and lower bands contract and expand when using Bollinger Bands.

He is an expert in financial niche, long-term trading, and weekly technical levels.
The primary field of Igor's research is the application of machine learning in algorithmic trading.
Education: Computer Engineering and Ph.D. in machine learning.
Igor regularly publishes trading-related videos on the Fxigor Youtube channel.
To contact Igor write on:
igor@forex.in.rs
