What is volatility in forex trading?
Volatility measures how much the price of a currency pair fluctuates. A forex pair with a price that fluctuates wildly hits new highs and lows, or moves erratically is considered highly volatile.
Volatility plays an important role in the trading market. Whether you are trading Forex, shares, stock, crypto, commodities, or anything else, to formulate a profitable strategy, you need to keep a close check on the volatility that prevails in the market. Since volatility tells traders and brokers about the dispersion of returns of the market index or particular security, everyone involved in trading tries to use volatility as a tool that facilitates trading. Many indicators and tools are used because it becomes difficult to be accurate when you are doing it a traditional way, that is, with a pen and paper. One such indicator is the Chaikin Volatility Indicator.
Marc Chaikin developed this indicator that highlights volatility by calculating the difference between the highs and each trading bar’s lows or each period. The difference between two moving averages, also known as the MAs, of a volume-weighted accumulation distribution line. The indicator comes with a default 10-day setting for both the H-L period and the volatility smoothing, but this can be easily altered.


With the Chaikin volatility bands’ help, the traders can assess the price movement of the securities. If there has been an increase in the volatility indicator over a short time period, you can expect the bottom to be near. Similarly, if, over a long time period, there has been a decrease in the volatility indicator, you can expect the top to be near. As with other indicators, it is always advised to use the Chaikin Volatility Indicator with other tools and indicators, the most common ones being the price envelope and the moving averages.


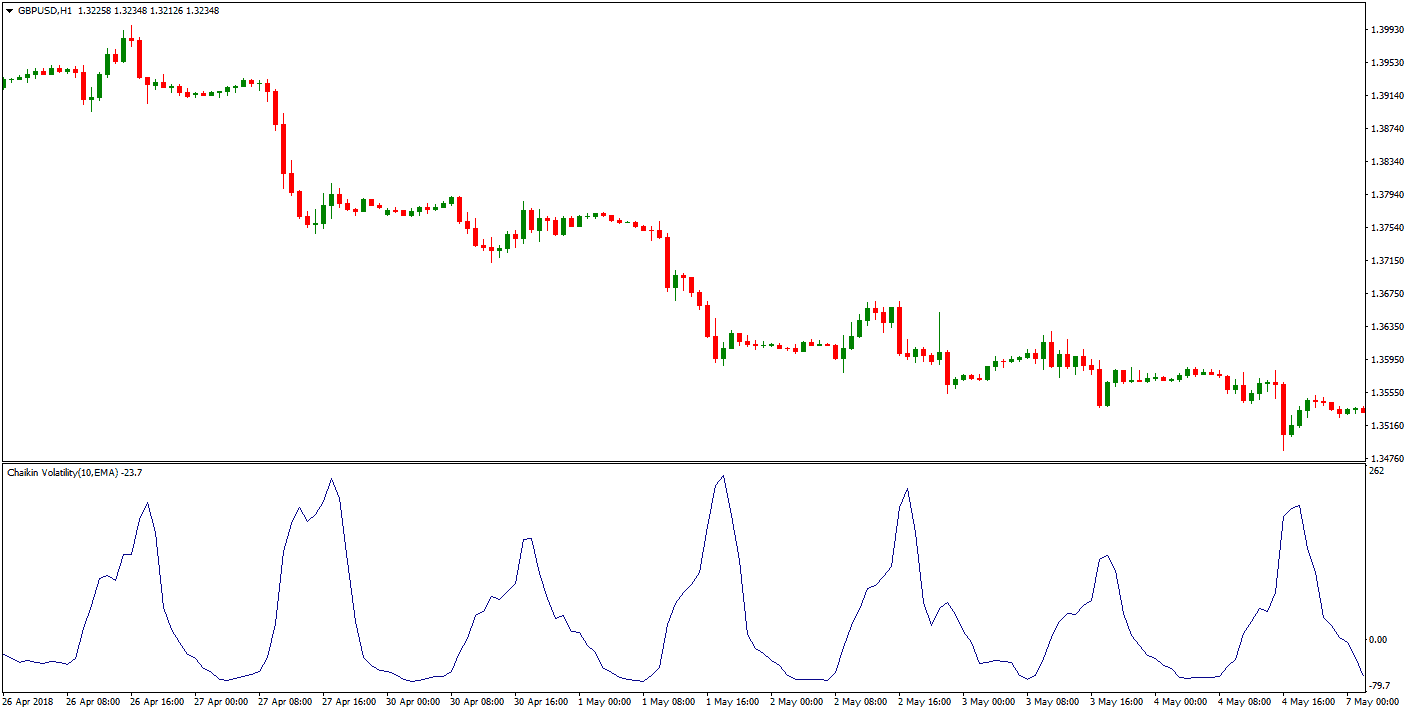
Chaikin volatility indicator represents an oscillator indicator that shows high and low volatility for any trading assets (currency pair, commodity, stock, etc.)
Free download Chaikin Volatility Indicator for MT4:
Download Chaikin Volatility Indicator
The Chaikin Volatility Formula

Every indicator runs its formula, which makes it unique. For the Chaikin Volatility Indicator, you need to calculate an exponential moving average first. It is done for the H-L period, usually 10 days. The next thing to do is to calculate the change in the MA for the same time period. This change is calculated in percentage. Once you have all the variables, you can easily find the volatility by using the formula given below:
Chaikin volatility calculation formula is:
(Exponential Moving Average [High-Low] – Exponential Moving Average [High-Low 10 days ago] ) divided by Exponential Moving Average [ High-Low 10 days ago] X 100
The Chaikin Volatility Indicator is popular among traders, investors, and brokers. It is often deemed a reliable indicator as it considers both the volume and the price of a security. It is very similar to the Average True Range, another indicator that compares the range of each successive day to calculate the commitment. However, unlike its contemporary, the Chaikin Volatility Indicator falls a little short as it does not consider trading gaps.
Trading gaps highlight the areas on the chart the security price moves rapidly, whether up or down. During this movement, very little or zero tradings happen. This creates a gap in the security chart. These gaps create a good opportunity for traders to exploit them and make a profit easily. Not considering trading gaps is one of the biggest drawbacks of the Chaikin Volatility indicator.
Chaikin volatility strategy
It is comparatively easier to look for trading signals using the Chaikin Volatility trading Indicator. Before the market reaches its top or bottom, there are periods of sharp increases. These are often followed by low volatility because of the moss of market interest.
Using the Chaikin volatility indicator and Bollinger Bands indicator, traders can create a trading strategy.
BUY if one-hour candle close is on lower B. Band AND Chaikin volatility indicator is at maximum volatility. Close trade when touching upper B.Band.
SELL if one-hour candle close is on upper B. Band AND Chaikin volatility indicator is at maximum volatility. Close trade when touching lower B.Band.
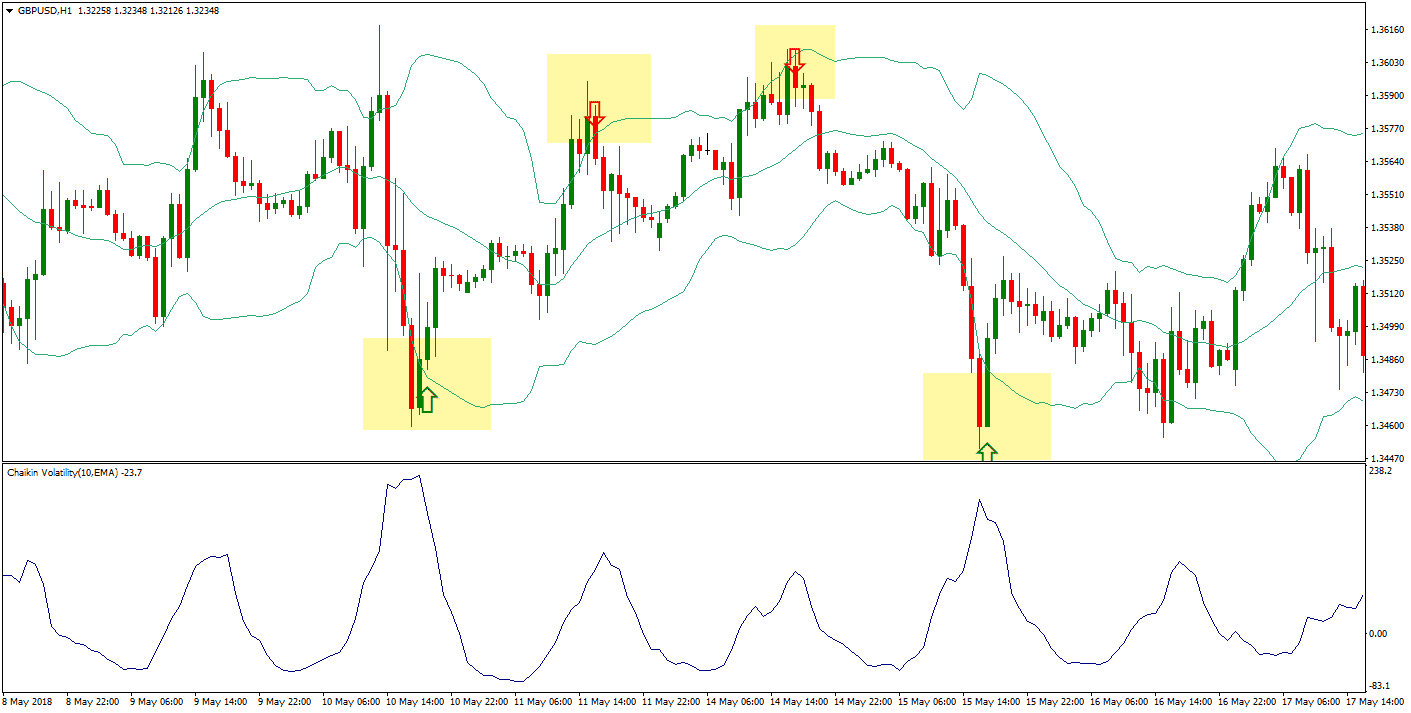
The above graph is of GBPUSD, in conjunction with the Bollinger bands and the Chaikin Volatility. The graph shows the following:
- When the market withdraws from a new high as it enters a trading range, the volatility peak occurs.
- If you look at the low volatility, you can see that the market range lies in a narrow band. There is no significant change in volatility, even when there is a breakout from this range.
- When the prices rise above the recent high, the volatility chases it and rises as well.
- Sharp volatility rises place before the market peak.
- Sharp volatility decline indicates a possible reversal.

He is an expert in financial niche, long-term trading, and weekly technical levels.
The primary field of Igor's research is the application of machine learning in algorithmic trading.
Education: Computer Engineering and Ph.D. in machine learning.
Igor regularly publishes trading-related videos on the Fxigor Youtube channel.
To contact Igor write on:
igor@forex.in.rs
