Today, I will present the Quasimodo Pattern, or, as more people know, the “Bearish Head and Shoulder Pattern.”
What is the Bearish Head and shoulder pattern?
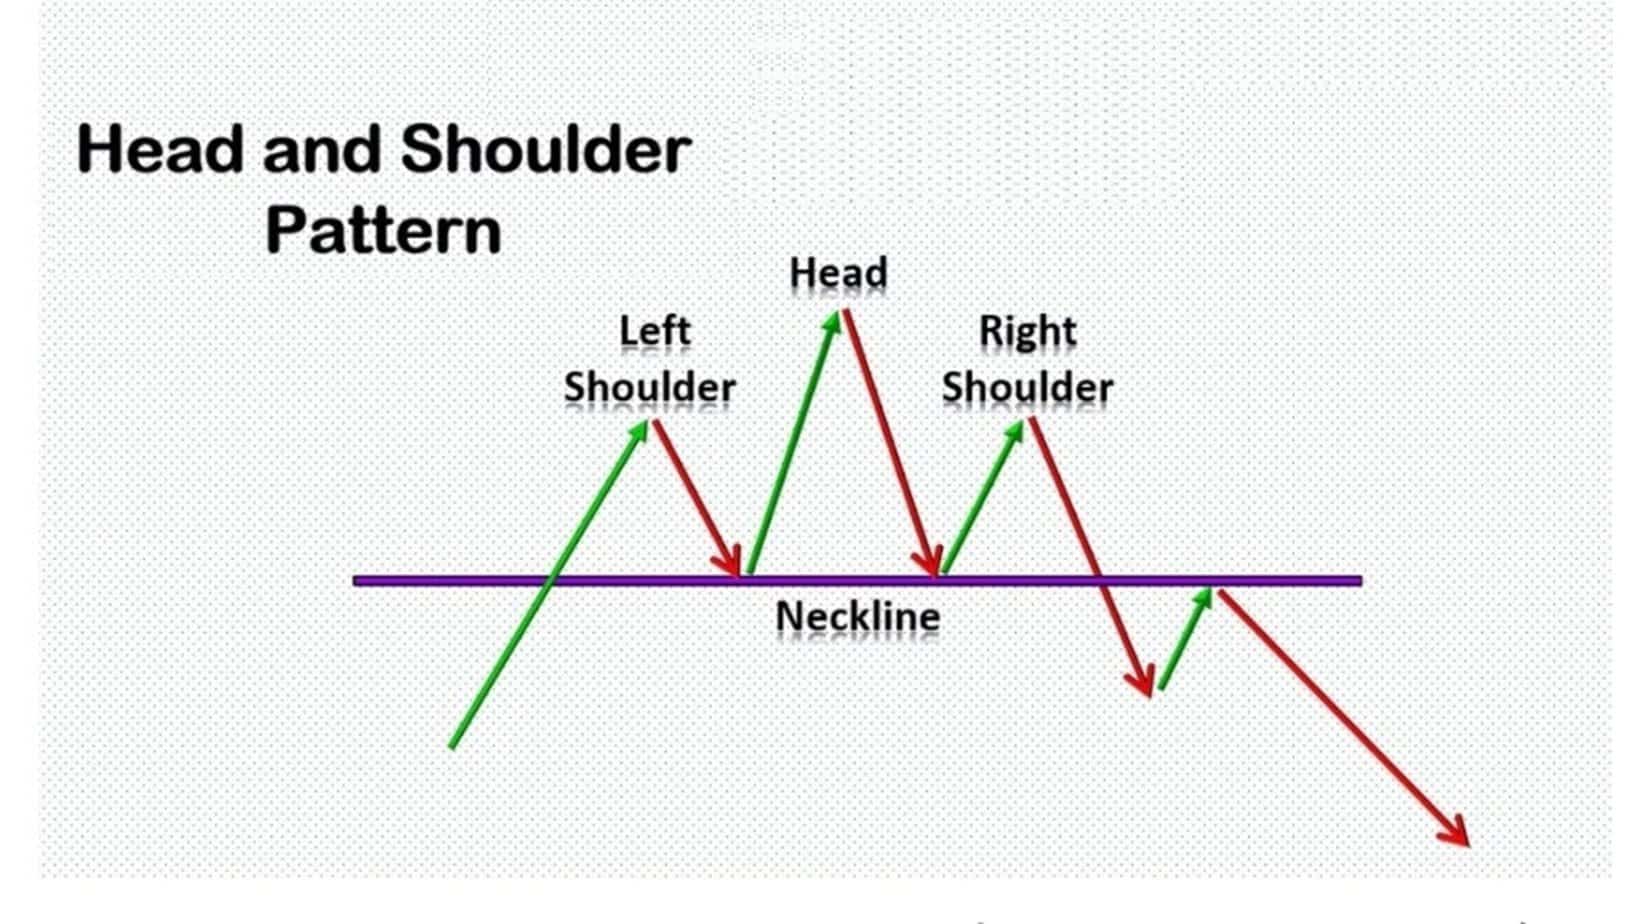
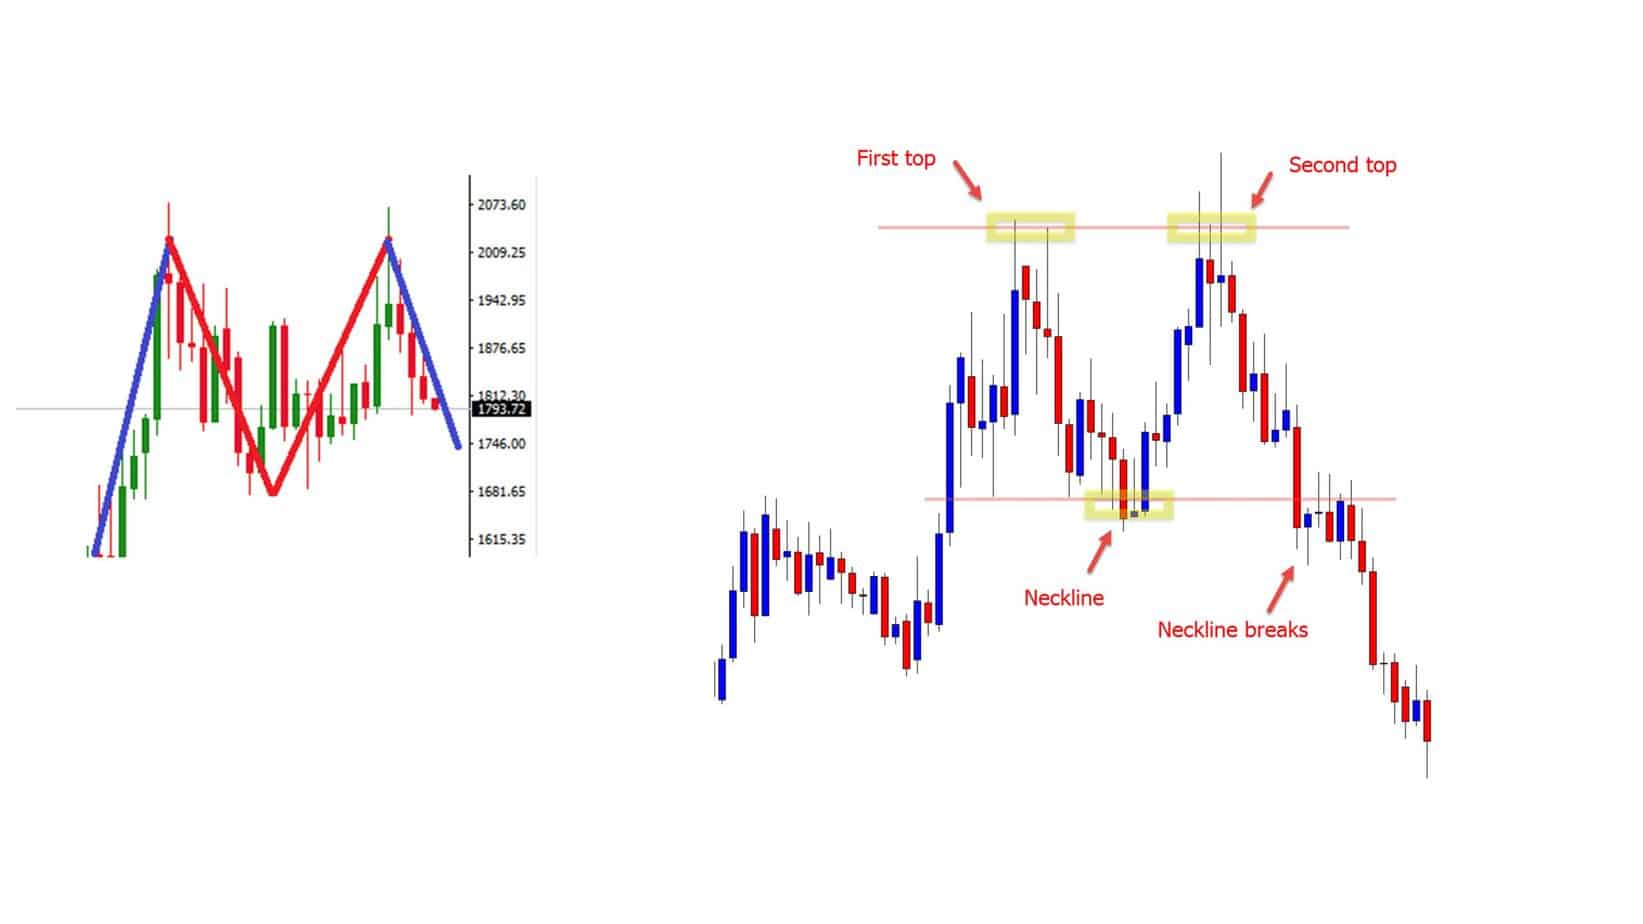
The Bearish Head and shoulder pattern represents a trading pattern consisting of one lower top as the left shoulder, another highest top (head), and another lower top (right shoulder). This pattern with strong resistance usually signs a future bearish trend.


You can now see the bearish head and shoulder pattern on this screen.


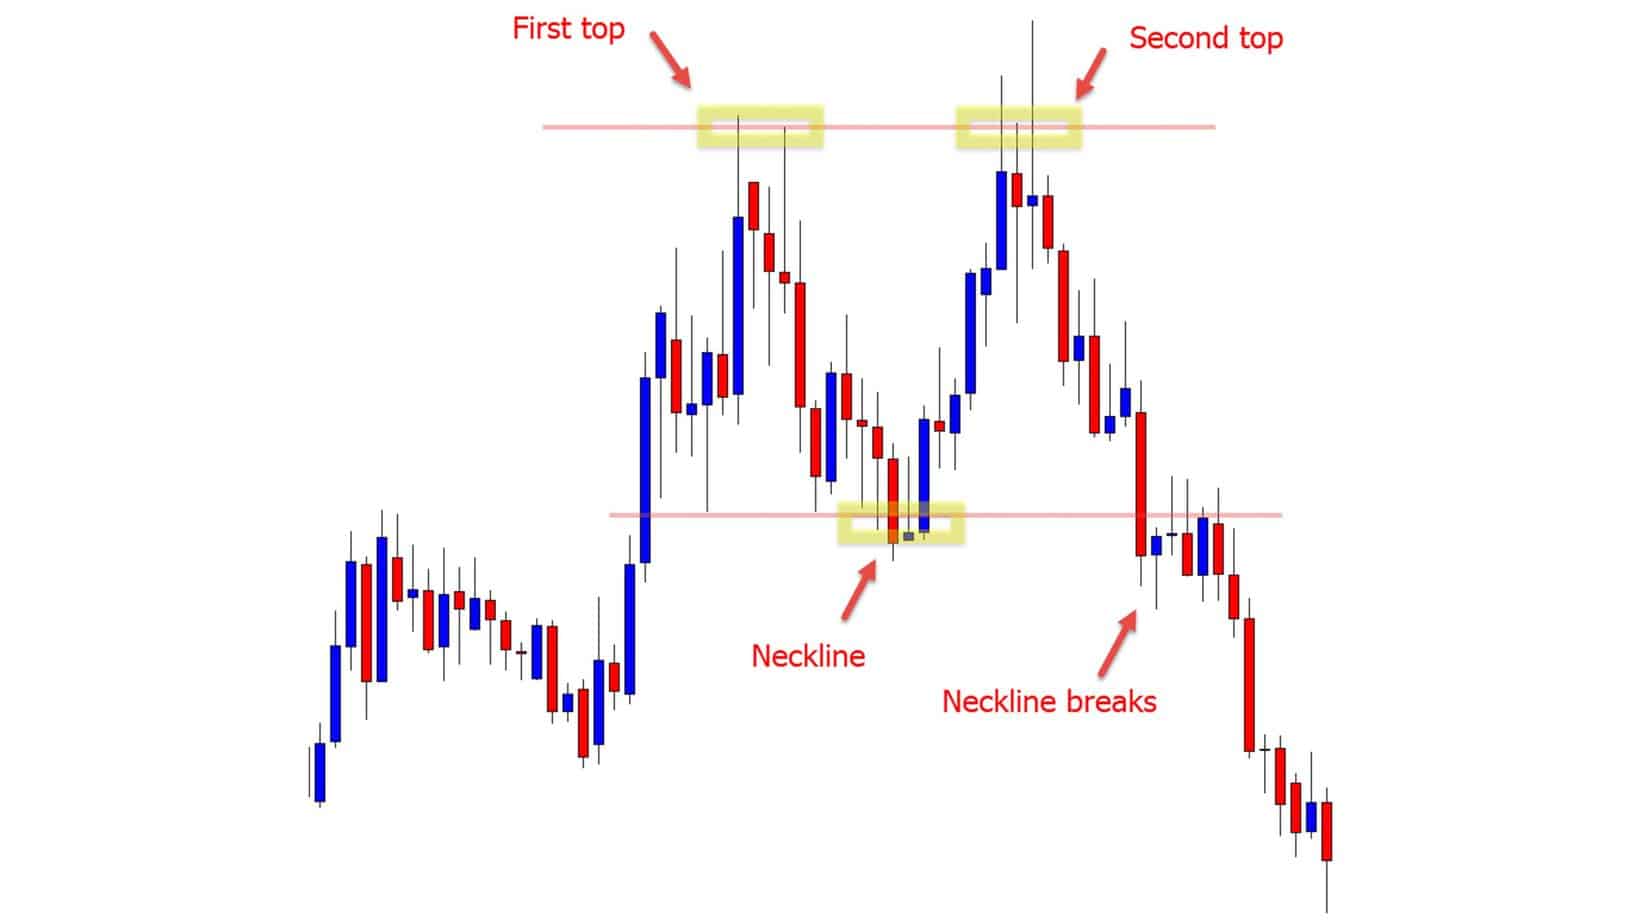
We often see this pattern on four-hour daily and weekly charts when we trade gold. I want to tell you, too, that there is another pattern that’s very similar to the head and shoulder pattern. It’s a double-top pattern. So you have the first top, then you have a neckline, then you have a second top, and then you have a trend break.
You can see right now on the screen:

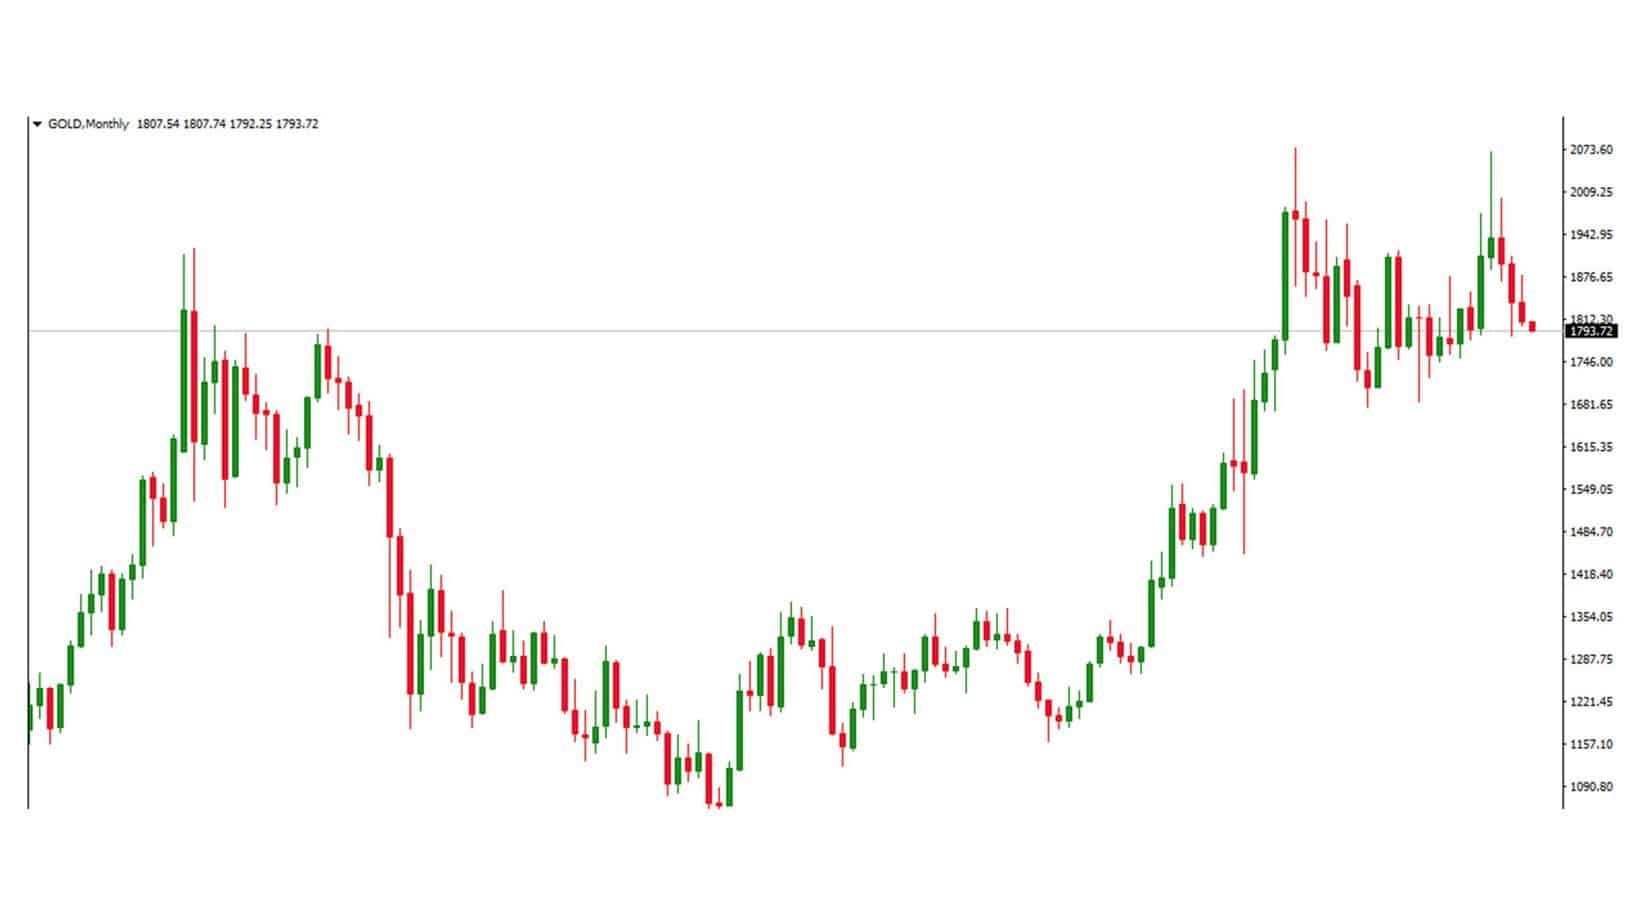
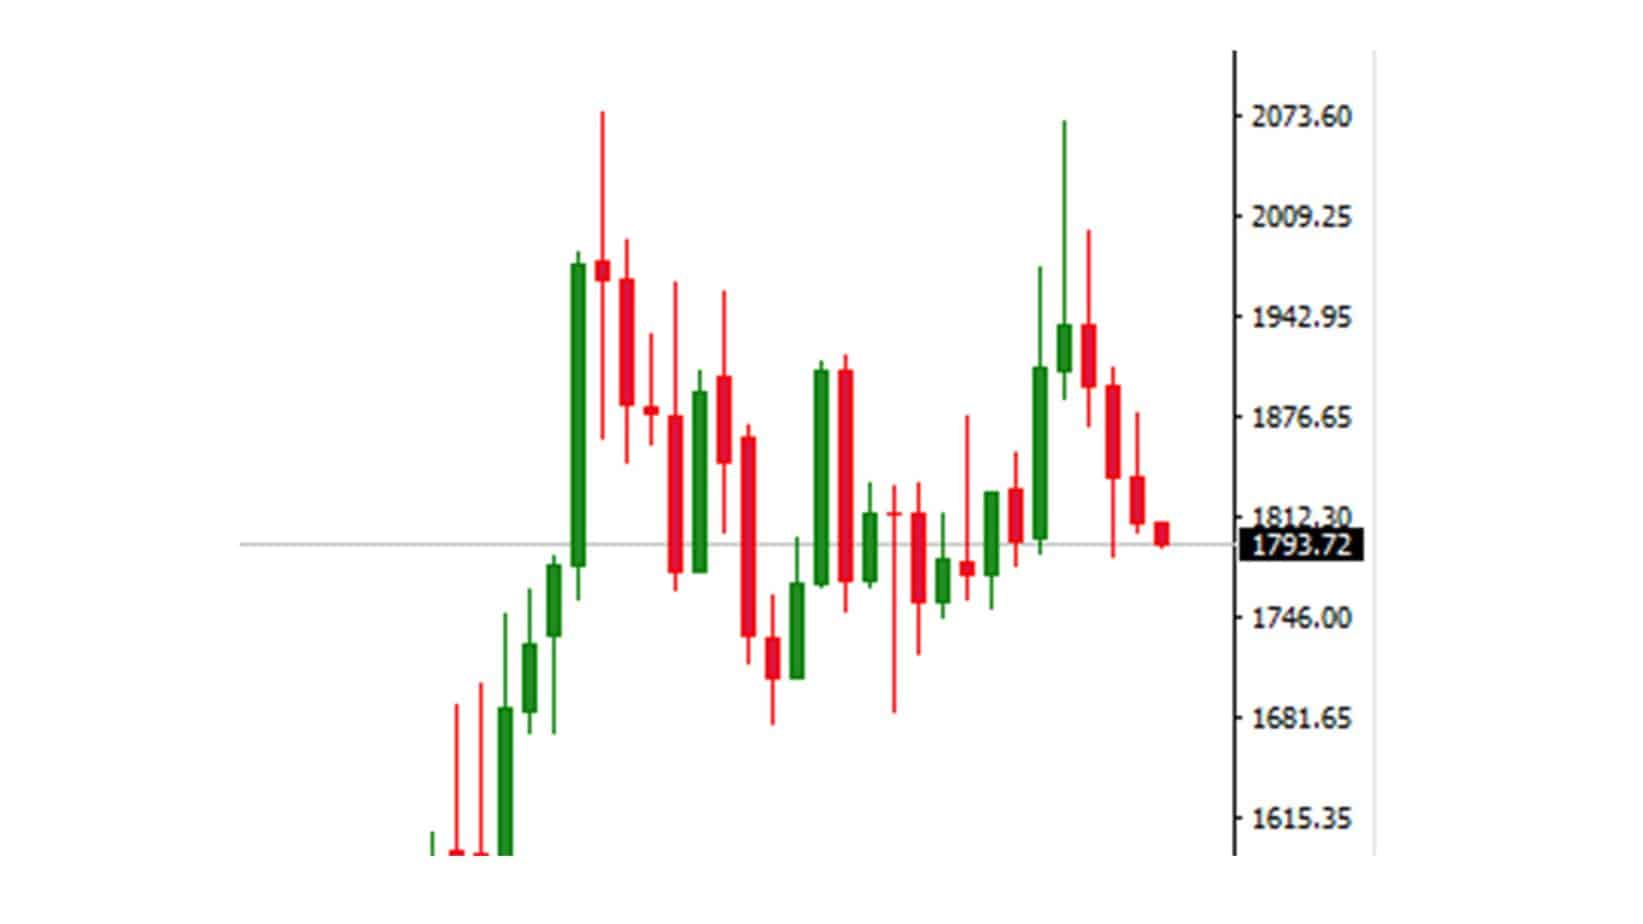
Gold monthly chart. On this monthly chart, we can spot exciting patterns. We had two highs in the last couple of months, and now we are making bearish moves. If you zoom in on this picture, you can see what I’m talking about. We can see two tops and some bearish moves right now that we need to describe technically and explain using the fundamental approach. So let me see again: on the left side, we have the current double-top monthly chart pattern, which is evident.
On the other hand, the first stop and second top neckline break. Right now, we are at the moment when the neckline breaks are over, and we are in a bearish move on a monthly chart.
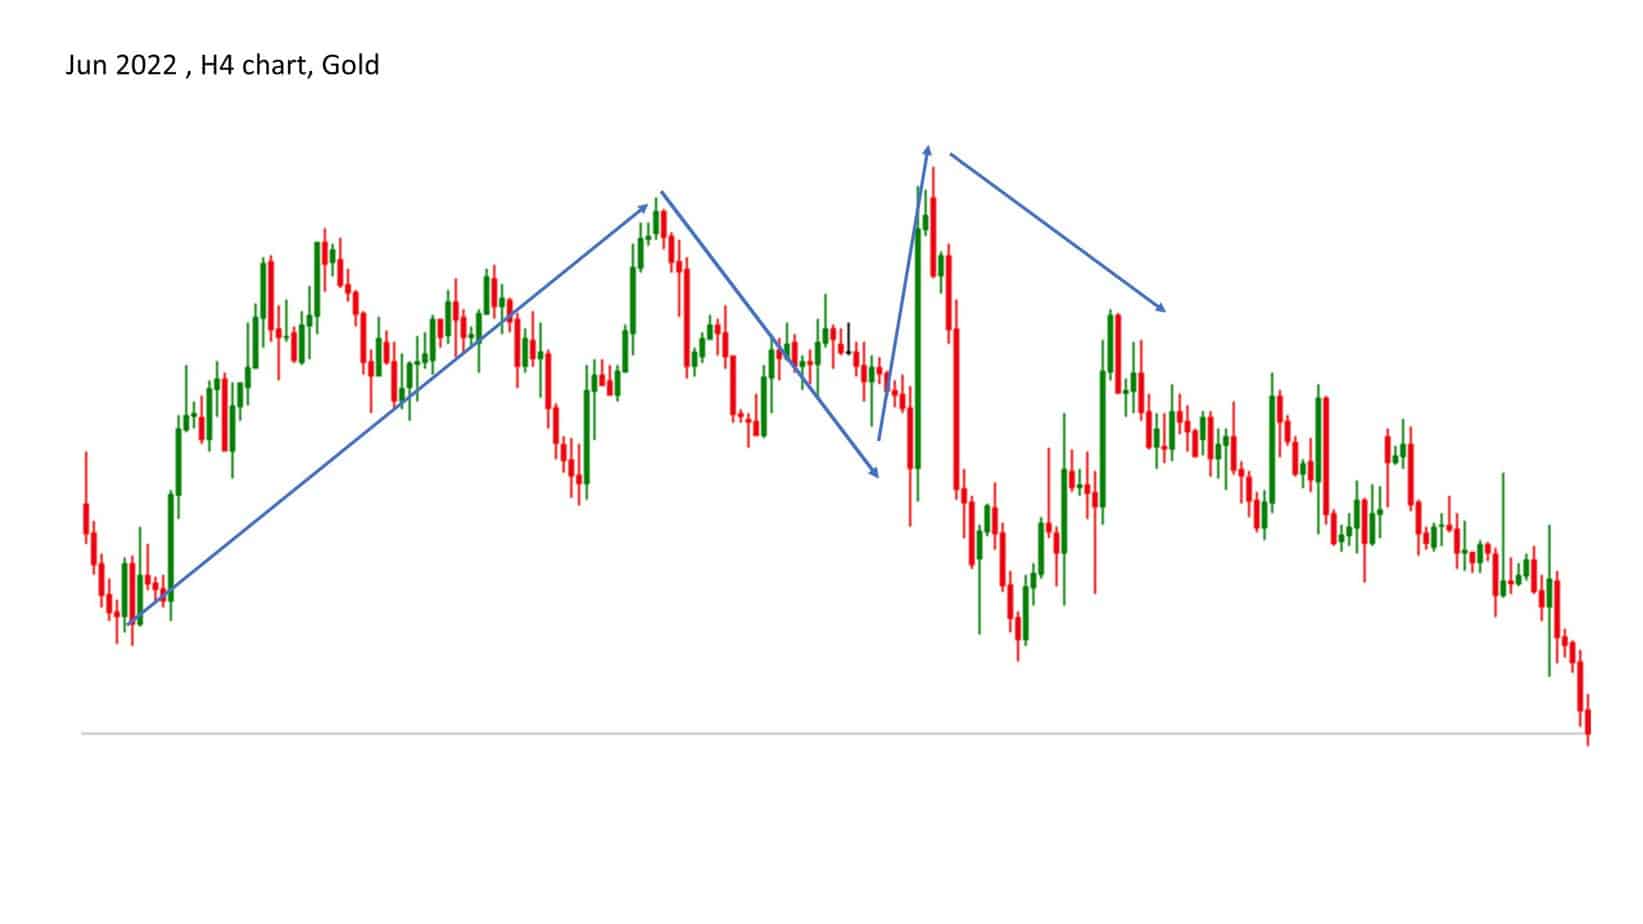
On the four-hour chart, we have a head-and-shoulder pattern this summer. So, this summer can provide a potential bearish trend for the gold price.
Please watch my video about Quasimodo Pattern:
If you go to the four-hour chart (image above), you can see that in June, we had one high, then they had a head, then a second shoulder, and right now, we’re in a bearish move. Both indicators, head and shoulders and double top on the monthly chart, show a bearish trend. The good thing is that the monthly chart bearish trend can be very long moved. So, we can have exciting spots to enter bearish trades all summer. Now, we will try to describe this and answer the critical question: why did this happen?
The interest rate in the US in the last 200 years
The first thing you need to know is that something has changed in the US market, and that is an interest rate hike.
We had a meager interest rate during 1945 when the country wanted to raise its stocks and significantly impact development.
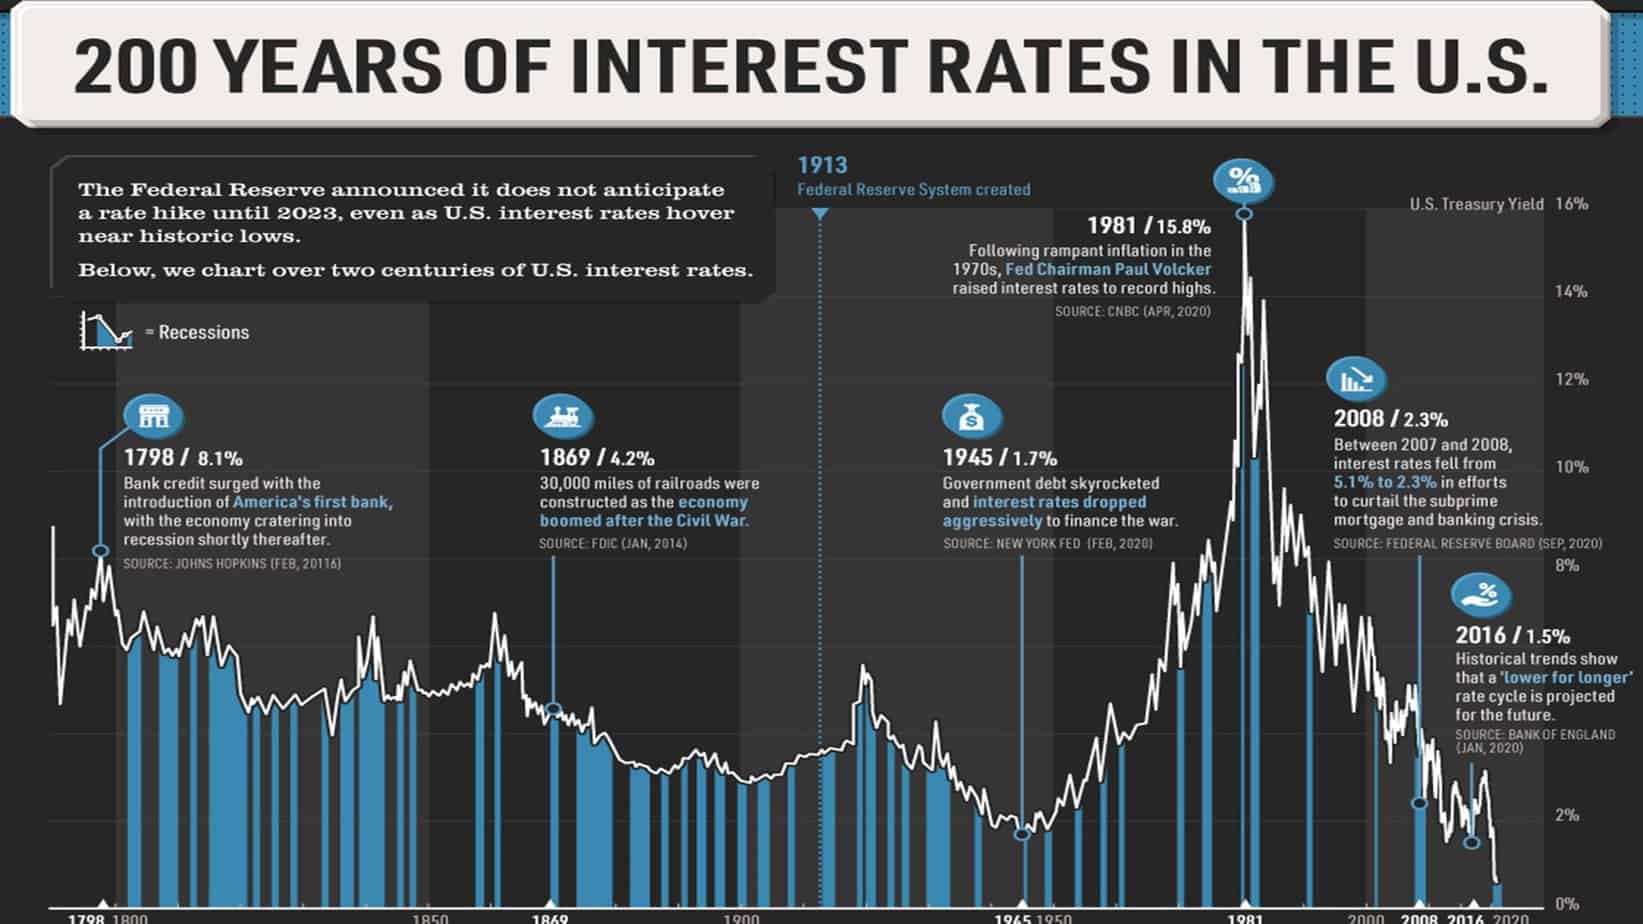
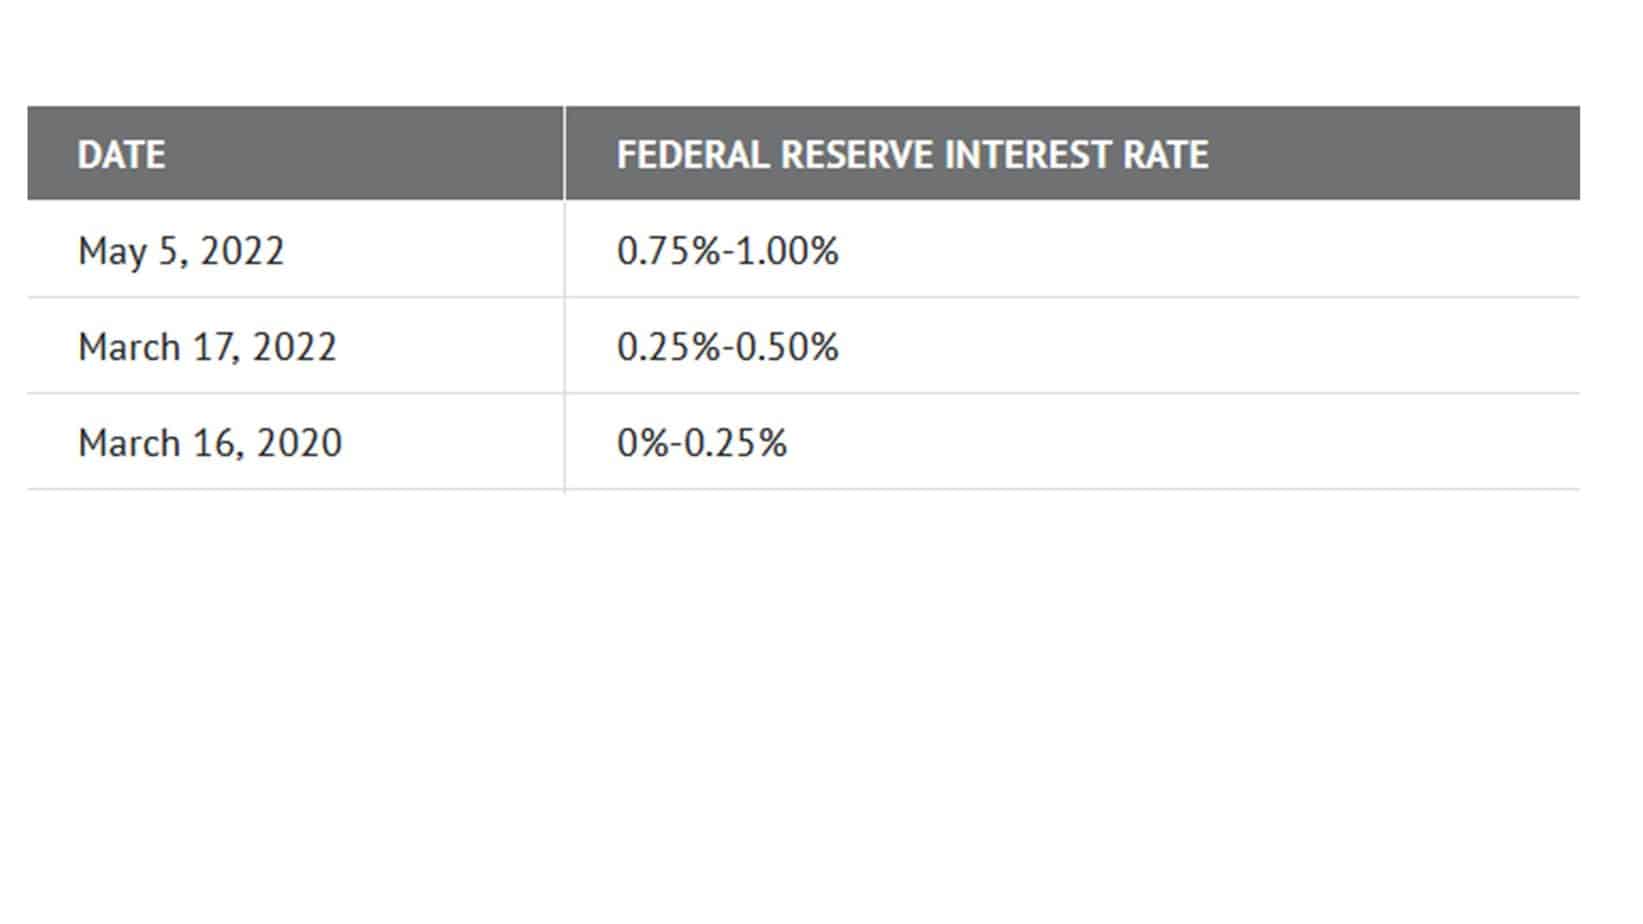
There is some story behind everything that happens. As you know, the interest rate in 2008 was 2.3%, but inflation and interest rates were no problems. Fourteen years ago, there was a crisis in real estate. However, when the crisis started between the two seven and two eight, interest rates fell from 5.1 to 2.3 to curtail the subprime mortgage and banking crisis. And right now, we are trying to increase interest rates because we want to fight against inflation. So what happened on March 16, 2020, when it was a corona disease? The Federal Reserve interest rate was between zero and 0.2%. On March 17, we had an interest rate rise from zero point 25% to 0.5%. And in May, just two months later, we had another interest rate rise to 1%. And this is not the end.
During this year, we can see interest rate rises, which can happen as a tool to fight against high inflation. Ultimately, we need to know that a scientist will tell you that interest rate and gold price have no impact and no strong correlation. But if you have just seen this graph in the last 20 years, you can see one essential thing. The thing that I want to tell you is straightforward. You want to increase the interest rate to fight against inflation, but you want to slow down your economy. Then, when you do that, one essential thing will happen. In this case, your currency, the dollar, will be stronger and stronger.
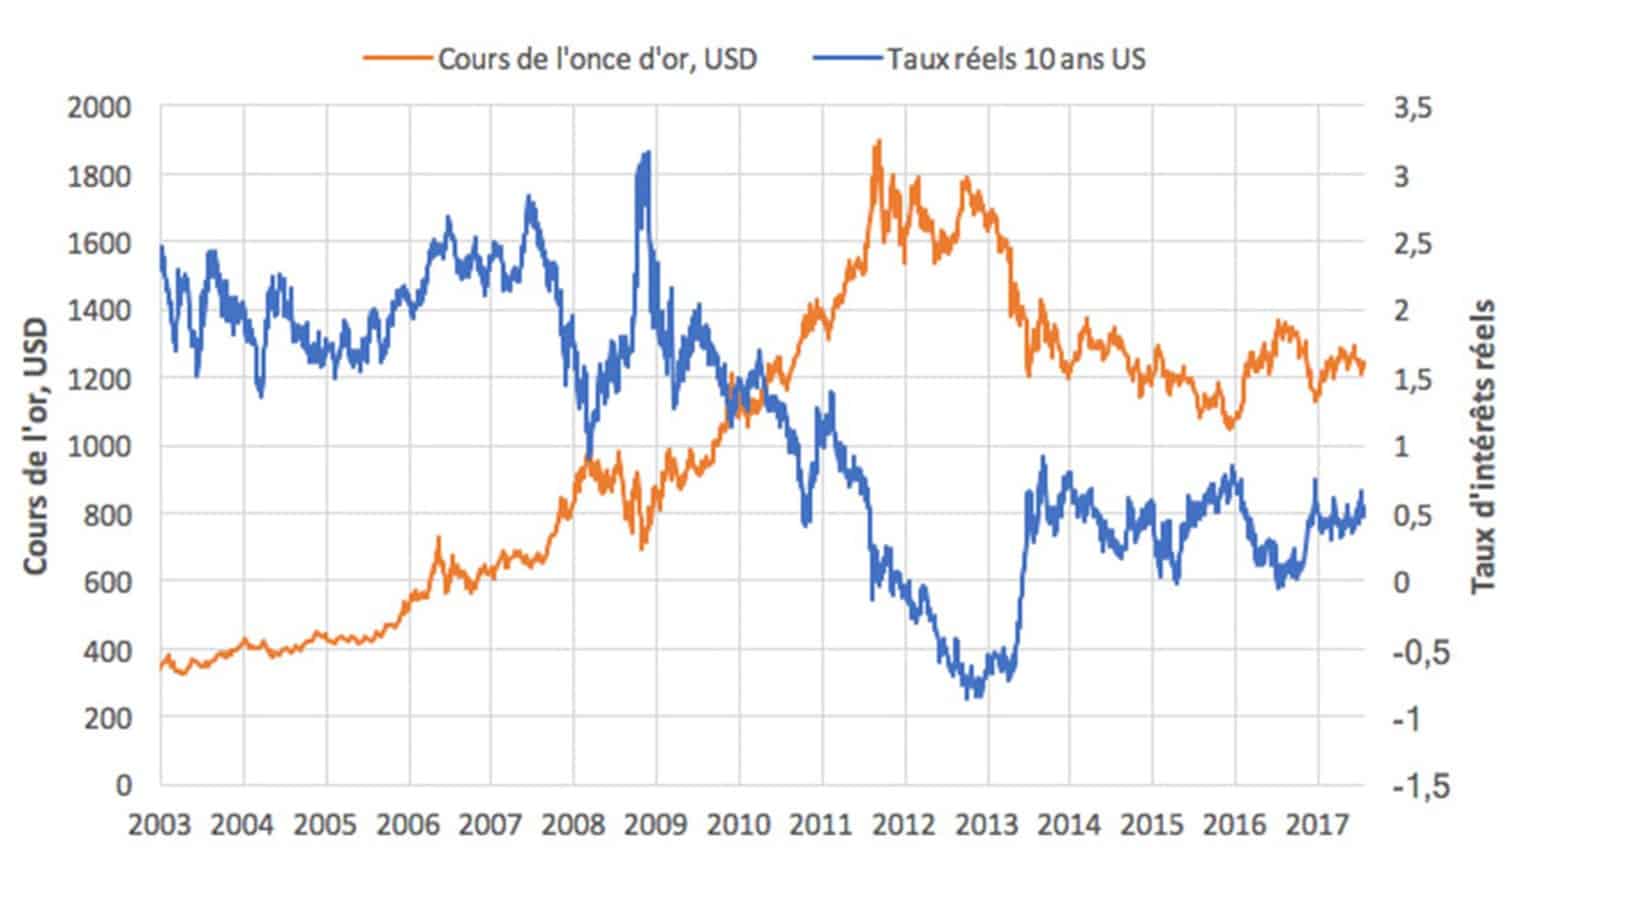
When we trade gold, we know the gold price is the ratio between gold and the US dollar. So when I say 2000 gold, gold prices, at that moment, if the dollar is more robust, the gold needs to be weaker. And if you look at this, we had a considerable gold price in 2013 and 2012, almost $2,000. And as you know, the interest rates were negative. Again, if you look at 2016 and 2017, you can see just like in the mirror route. Like in the mirror, you can see the price between the gold and the interest rate. So, if we increase the interest rate, there is a fundamental impact and explanation that the gold price can fall. But I want to tell you one more thing that we must be careful about if this happens. If the stock market starts to go down, more people will not invest in stocks anymore, and maybe at that moment, people will begin to invest in precious metals like gold and silver, which can make gold bullish.
And very often, after this massive downtrend of gold some moment, if the stock market crashes, we can see the gold pricing, so we need to be careful because if something changes, it’s not simply on the market; everything sometimes things can be complicated we can see the different price and gold we can see the market wants to see a weaker dollar, et cetera, et cetera. So I want to tell you we need to be careful. Please watch when you invest money anywhere. This is not an investment challenge; it is just about fundamental technical analysis. When investing, you must be careful and think there’s always a second story, the second side of the coin.

He is an expert in financial niche, long-term trading, and weekly technical levels.
The primary field of Igor's research is the application of machine learning in algorithmic trading.
Education: Computer Engineering and Ph.D. in machine learning.
Igor regularly publishes trading-related videos on the Fxigor Youtube channel.
To contact Igor write on:
igor@forex.in.rs
