Table of Contents
TradingView is a popular online platform allowing traders to analyze and trade financial markets using various indicators and charting tools. One of the critical advantages of TradingView is its extensive library of integrated and custom-made indicators, which can help traders make more informed decisions and identify profitable trading opportunities.
Please read our latest article to learn how to calculate pips on Tradingview.
Integrated indicators are pre-built tools with the TradingView platform, designed to provide technical analysis and market trends. These indicators include popular tools such as moving averages, Bollinger Bands, Relative Strength Index (RSI), etc. They can be easily accessed and applied to charts, helping traders to visualize trends and patterns and make better trading decisions.


On the other hand, custom-made indicators are unique tools created by traders or developers specifically tailored to meet their individual trading needs. These custom-built indicators can be made using the TradingView Pine Script programming language, which allows traders to create complex and highly advanced indicators, ranging from simple moving averages to complex algorithms.


By creating custom-made indicators, traders can better understand the markets and their trading strategies while gaining a competitive edge over other traders. They can also identify more nuanced market trends, such as hidden divergences or trend reversals, which traditional indicators may not readily identify.
Please see the whole video about Eliott Waves indicators on the TradingView platform:

Elliott Wave indicators on TradingView
Elliott wave indicators are based on the theory, which suggests that financial markets move in a series of repetitive cycles or waves. These waves are driven by collective investor psychology, which alternates between optimism and pessimism, causing prices to rise and fall in a predictable pattern.
In TradingView, there are a lot of excellent wave count indicators such as ZigZag, 3RD Wave, Elliotte Wave Counter, Momentum-based ZigZag, Zig Zag Channels, etc.
To count waves using Elliott wave indicators, traders look for specific patterns in the price movements of a financial asset, such as a stock or currency pair. These patterns comprise a series of impulse waves, which move toward the overall trend, and corrective waves, which move against the trend.
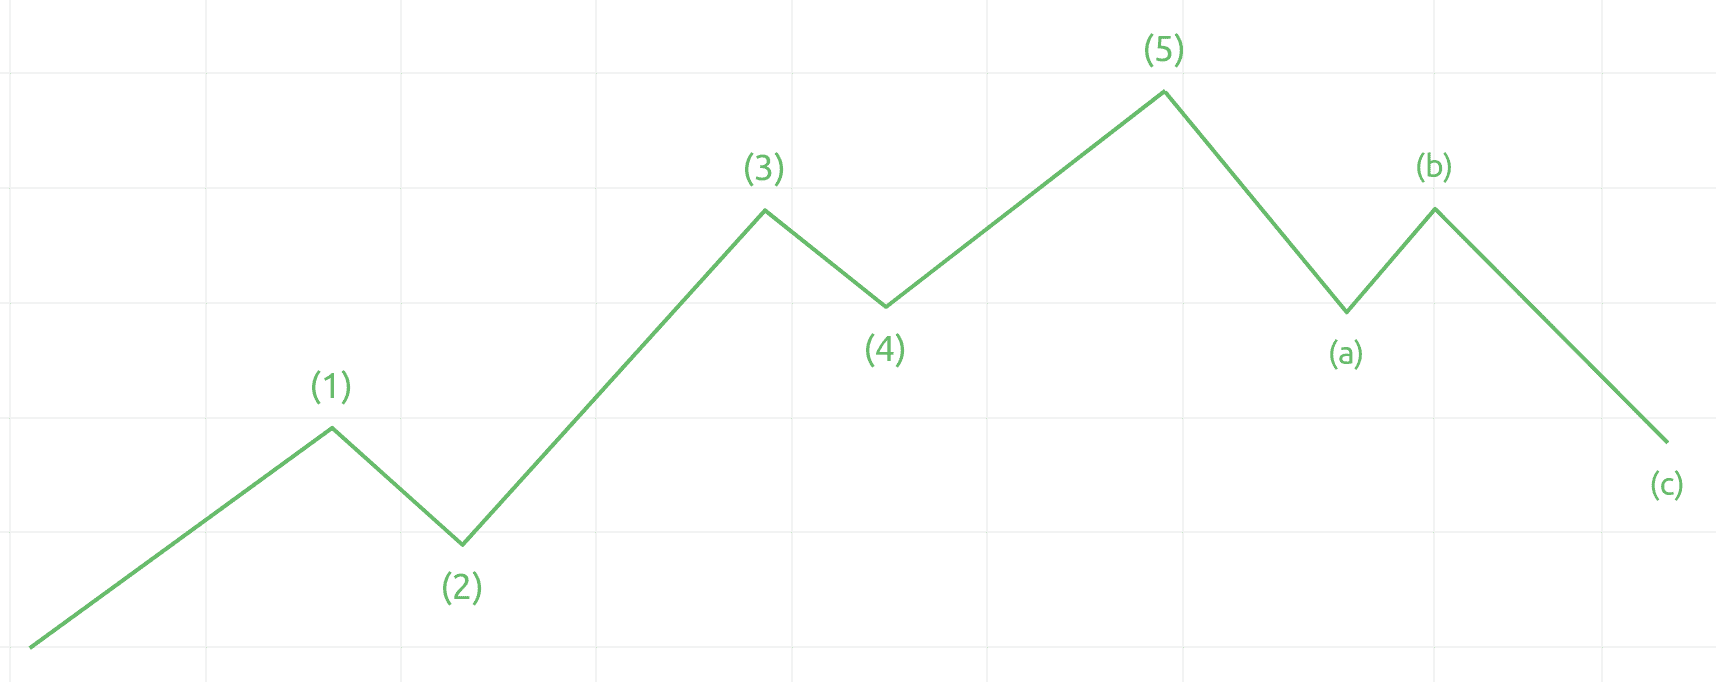
The basic Elliott wave pattern consists of five waves in the direction of the trend, followed by three corrective waves. The first wave, labeled Wave 1, is an impulse wave that marks the beginning of a new trend. The second wave, labeled Wave 2, is a corrective wave that retraces some of the gains made in Wave 1.
The third wave, labeled wave 3, is usually the longest and strongest wave in the pattern, marking the continuation of the trend. Finally, the fourth wave, labeled Wave 4, is another corrective wave that retraces some of the gains made in Wave 3.
Finally, the fifth wave, labeled wave 5, is another impulse wave that marks the end of the trend. This is followed by three corrective waves, A, B, and C, moving against the trend.
Elliott wave indicators use mathematical algorithms to identify and track these real-time patterns, helping traders anticipate market movements and make more informed trading decisions. However, it is essential to note that, like all technical indicators, Elliott wave indicators are not infallible and should be used with other analysis and risk management techniques.
3rd wave as The Best Elliott Wave Indicator on TradingView
The best Elliott Wave Indicator on TradingView is a 3rd wave indicator. This indicator focuses explicitly on the third wave of the Elliott Wave pattern, which is typically the most robust and powerful wave.
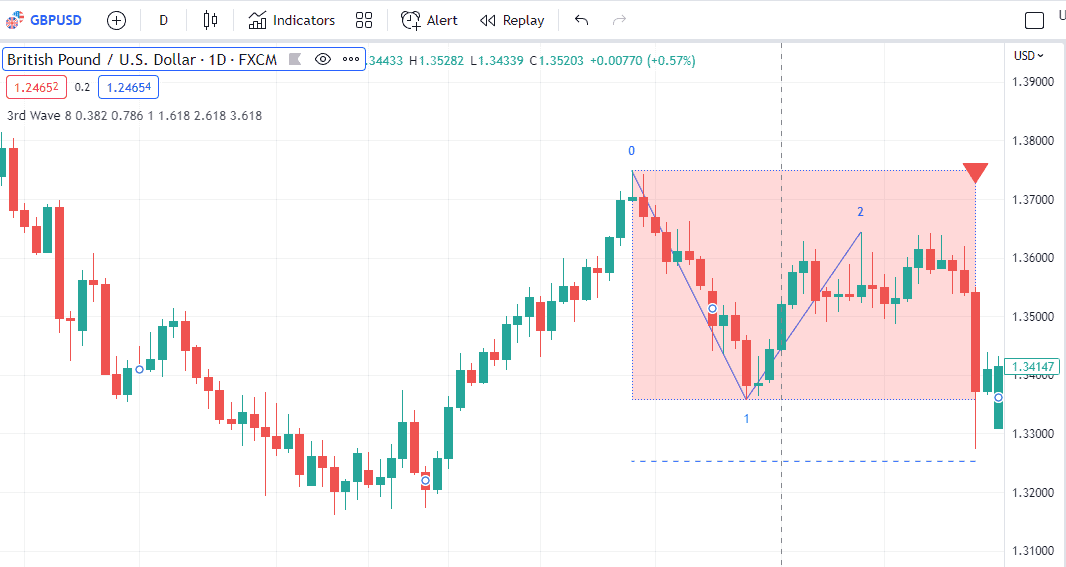
The TradingView 3rd Wave indicator is a technical analysis tool designed to assist traders in identifying potential trading opportunities based on the Elliott Wave Theory.
One of the key benefits of the TradingView 3rD Wave indicator is its ability to compare volumes between waves 1, 2, and 3. This information can be used to determine the trend’s strength and identify potential entry and exit points for trades.
The indicator analyzes price data and identifies patterns consistent with the Elliott Wave Theory. It then uses algorithms to calculate the relative volumes of the first, second, and third waves, providing traders with a visual representation of the trend’s strength.
However, it is essential to note that no indicator or tool can predict the market’s future movements with 100% accuracy. Therefore, traders should use the TradingView 3rD Wave indicator with other technical analysis and risk management strategies to make informed trading decisions.
Overall, the TradingView 3rd Wave indicator can be a valuable tool for traders familiar with the Elliott Wave Theory and looking to identify potential trading opportunities based on this theory. However, as with any technical analysis tool, it is essential to understand its limitations and to use it as part of a broader trading strategy.
Elliotte Wave Counter Indicator on TradingView
The Elliott Wave Theory is a famous technical analysis tool traders use to identify potential market trends and opportunities. One of the critical components of this theory is wave counting, which involves analyzing price movements and identifying patterns consistent with the Elliott Wave Theory.
The Elliott Wave Counter indicator is a popular tool on TradingView designed to assist traders with wave counting. This indicator uses advanced algorithms to identify and count waves in real-time, helping traders to identify potential entry and exit points for trades.
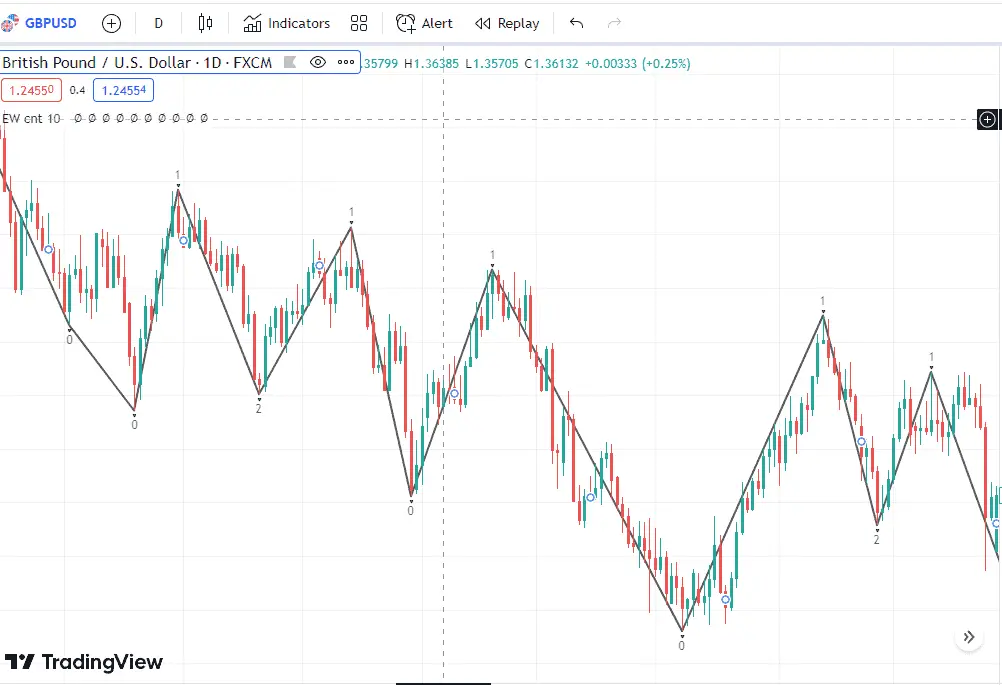
The Elliott Wave Counter indicator analyzes price data and identifies patterns consistent with the Elliott Wave Theory. It then uses advanced algorithms to calculate the number of waves in the current trend and to identify potential reversal points based on this analysis.
One of the key benefits of the Elliott Wave Counter indicator is its ability to provide traders with real-time feedback on the current market trend and potential trading opportunities. By identifying likely wave counts and reversal points, traders can make informed decisions about when to enter or exit a trade.
Another benefit of the Elliott Wave Counter indicator is its user-friendly interface. The indicator provides a clear and easy-to-understand visual representation of the current market trend and potential reversal points, making it accessible to traders of all experience levels.
Custom-Made Indicators in TradingView
One of the critical advantages of TradingView’s custom-made indicators is that they can be shared and copied among other traders, providing a collaborative environment for traders to improve each other’s strategies and gain valuable insights into the markets. This can also help traders identify new opportunities and styles they may not have considered.
However, it’s important to note that custom-made indicators should not be relied upon solely for trading decisions. They should be viewed as complementary to traditional indicators and technical analysis rather than a replacement. Traders should also be cautious when using custom-made indicators created by others and always test them thoroughly before incorporating them into their trading strategies.
Conclusion
In conclusion, TradingView’s integrated and custom-made indicators provide traders with powerful tools to analyze financial markets and make informed trading decisions.
Elliott Wave indicators are different in visual representation as well in the way how they count waves.
With a vast library of pre-built indicators and the ability to create custom-made indicators using Pine Script, traders can gain a deeper understanding of the markets and gain a competitive edge. However, using these indicators in conjunction with traditional technical analysis is essential as consistently exercising caution and due diligence when incorporating custom-made indicators into their strategies.
To learn how to trade using the TradingView platform, visit our article.

He is an expert in financial niche, long-term trading, and weekly technical levels.
The primary field of Igor's research is the application of machine learning in algorithmic trading.
Education: Computer Engineering and Ph.D. in machine learning.
Igor regularly publishes trading-related videos on the Fxigor Youtube channel.
To contact Igor write on:
igor@forex.in.rs
Related posts:
- What is Elliott Wave Theory? How to Start Counting Elliott Wave?
- Download Elliott Wave Indicator
- Wyckoff and Elliott Wave Forex Strategy! – Wyckoff Accumulation & Wyckoff Distribution!
- The Best Buy Sell Signal Indicator in TradingView!
- How to Use Volume Profile Indicator on TradingView for Free?
- Can I Trade on TradingView App?
- Can You Trade on TradingView?
- How to Calculate Pips on TradingView?
- How to Compare Charts on TradingView?
- TradingView Review – Key Findings in 2024.
- How to Add Moving Average to RSI in TradingView? – Steps and Video
- How to Backtest on TradingView? – Free Strategy Scripts Without Coding
