Table of Contents
TradingView stands out as one of the most popular platforms for novice and experienced traders. It offers myriad tools to analyze, forecast, and monitor financial markets. Central to its appeal is the extensive library of premade indicators. These indicators, designed by a community of professional traders, developers, and enthusiasts, provide invaluable insights into market trends, momentum, volume, volatility, and various other aspects of market analysis.
Please read our latest article to learn how to calculate pips on Tradingview.
Indicators are mathematical calculations based on the price, volume, or open interest of a security or contract used to forecast financial or economic trends for those unfamiliar with the term. On TradingView, users not only have access to classic indicators such as the Moving Average, RSI (Relative Strength Index), and MACD (Moving Average Convergence Divergence), but they can also benefit from a wide array of custom indicators shared and developed by the community.


What is The Best Buy Sell Signal Indicator in TradingView?
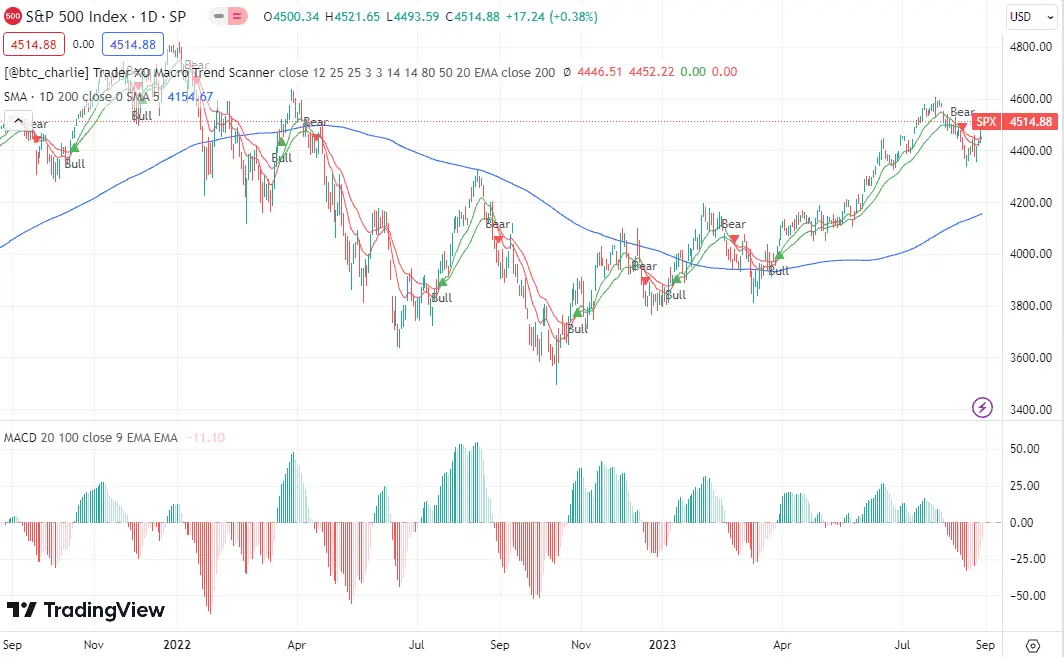
The best buy-sell indicator in the TradingView platform is the Trader XO Macro Trend Scanner. This indicator offers buy and sell entry points on the chart, following EMA and RSI indicators’ trends. Combined with the MACD histogram and 200 EMA indicator, it has the best accuracy.


Please see the video on how to use the script:
Components of the Trader XO Macro Trend Scanner Strategy
1. EMA RSI Indicators Trend:
The Exponential Moving Average (EMA) combined with the Relative Strength Index (RSI) forms the foundational layer of the scanner. As explained previously, the EMA helps identify the momentum and trend of the market based on recent price action. When combined with RSI, which measures the speed and change of price movements, it offers a dual perspective on the market’s trend and strength.

2. MACD Histogram with 20 and 100 MA Crossover:
The Moving Average Convergence Divergence (MACD) histogram provides insights into the market’s momentum. It does this by tracking the difference between two moving averages, in this case, the 20-period and 100-period MA. When the MACD goes above the zero line, it signals potential bullish momentum, while a drop below can hint at bearish momentum. The 20 MA and 100 MA crossover can further validate these signals, offering a clearer picture of potential market turns.
3. 200 EMA on the Daily Chart:
The 200 EMA on a daily chart is often considered a critical indicator for trend direction. If the price is above the 200 EMA, it generally indicates a long-term uptrend, and if it’s below a downtrend. By integrating the 200 EMA, the Macro Trend Scanner offers a broader view of the market’s direction, ensuring traders can align their strategies with the predominant trend.
Why Trader XO Macro Trend Scanner Stands Out:
The strength of the Trader XO Macro Trend Scanner lies in its comprehensive approach:
- Comprehensive Analysis: Combining EMA, RSI, MACD, and the 200 EMA consolidates multiple market perspectives into a singular view.
- Clear Visual Signals: Offering clear buy and sell entry points on the chart eliminates the guesswork, making it user-friendly even for novice traders.
- Accuracy: Incorporating the MACD histogram, particularly with the 20 and 100 MA crossover and the EMA 200 on the daily chart, dramatically enhances the tool’s accuracy.
- Adaptability: The scanner can be adjusted for different trading styles, whether you’re a swing trader, day trader, or long-term investor.
How does the Trader XO Macro Trend Scanner Script work?
In the vast realm of technical analysis, the combination of Exponential Moving Averages (EMAs) and the Stochastic Relative Strength Index (RSI) stands out as a potent pairing to gauge market dynamics. This script merges the benefits of both indicators, offering traders a comprehensive insight into price trends and momentum. Let’s delve into the intricacies of how this script functions.
EMAs: Signaling Trend Direction
What are EMAs? EMAs are moving averages that emphasize recent data points, making them more reactive to price changes than simple moving averages. They offer a smooth curve, representing the trend over a specified period.
How do they work in the script? The core principle hinges on the relationship between a short-term EMA and a long-term EMA. When the short-term EMA crosses above the long-term one, it indicates potential bullish momentum, suggesting a favorable environment for long trades. Conversely, a bearish scenario is painted when the short-term EMA falls below its long-term counterpart. This script amplifies this indication by coloring the candles based on these crosses, offering a more visual representation.
However, EMAs alone don’t present a foolproof trading strategy. They must be combined with other tools or price action analysis for more precise decision-making. This script’s adaptability shines here, as users can modify EMA settings to align with their strategies.
Stochastic RSI: Gauging Trend Strength
Understanding Stochastic RSI: Stochastic RSI magnifies the RSI readings concerning its high and low points, offering a more sensitive momentum gauge. When the Stochastic RSI exceeds 80, the asset might be overbought, and when it’s below 20, it might be oversold. These zones hint at solid momentum in the trend’s direction.
Functionality in the script: A pivotal feature is its ability to detect crosses between the Stochastic RSI (K) and its 3-period average (D). Such crosses can indicate a potential shift in momentum, making them crucial for traders. Although the script doesn’t directly point out divergences between price and Stochastic RSI, the crosses above implicitly suggest potential divergences.
Symbiotic Relationship: EMAs and RSI
The synergy between EMAs and RSI in this script is where its utility truly shines:
- EMAs pinpoint potential shifts in market trends.
- Stochastic RSI reveals the strength or weakness of these trends.
Together, they provide a robust framework to anticipate and act upon potential trend reversals, guiding traders on adopting a bullish or bearish stance.
What Sets It Apart?
While EMAs and RSI are standard indicators on many platforms, this script stands out because of its unique visual representation and alert system. It notifies users of critical Stochastic RSI and EMA crosses, providing timely cues for potential market actions.
Features at a Glance:
- Customization: Adapt the averages used in the script to your preference.
- Display Flexibility: Choose between showcasing one or both crossing EMAs.
- Alert Mechanisms: You will be notified about EMA crosses and pivotal Stochastic RSI movements. For instance, if Stochastic RSI moves above 80 and dips below it, an alert will trigger, accompanied by a visual cue.
- Personalization: Modify colors to suit your aesthetic preference or to align with your trading themes.
Conclusion
The Trader XO Macro Trend Scanner embodies a holistic approach to market analysis on the TradingView platform. It synergizes critical technical indicators, providing traders with concise buy and sell signals rooted in a multi-dimensional market view. As with all trading tools, while it enhances decision-making, traders should also consider other market factors and risk management strategies before moving.

He is an expert in financial niche, long-term trading, and weekly technical levels.
The primary field of Igor's research is the application of machine learning in algorithmic trading.
Education: Computer Engineering and Ph.D. in machine learning.
Igor regularly publishes trading-related videos on the Fxigor Youtube channel.
To contact Igor write on:
igor@forex.in.rs
