Table of Contents
Ralph Nelson Elliott created Elliot Theory in the 1930s. It is an impeccable but scarcely used tool for understanding the changes in the market through the psychology of investors. The opinions on this tool are mixed, and some people side with it, while others find it controversial.
What is Elliott Wave Theory?
The Elliott Wave Theory represents a methodology that identifies impulse and corrective waves patterns on the chart. The theory is based on Ralph Nelson Elliott’s opinion that crowd behavior tends to trend and reverse in identifiable cycles. Usually, the direction of the trend is unfolding in 5 waves.


Learning about the foundation is essential to comprehend the inner findings of their theory. The Elliott wave theory consists of two crucial elements: momentum and the fractal composition of the stock prices.


Elliott Wave Theory and Momentum
Momentum is the speed or velocity of price changes in an asset (stocks, forex, commodities). In hindsight, Fundamentally, it means to determine the effect of the trend. Investors use this statistic to determine the uptrend to buy the shares and sell them during the downtrend.
A high momentum will indicate the speed at which the stock prices are going up or down. When the momentum wanes, the prices tend to go sideways. In a more comprehensible language, when the investors have the same outlook for a stock, the prices go in a single direction, also called impulse-momentum.
On the contrary, when the players don’t look through the same mindset, the prices hardly falter, creating a sideways momentum known as corrective momentum.
Elliott Wave Theory and price action’s fractal nature
According to the Elliott wave theory, fractal nature means a sequence of waves that further divide into sub-waves. Hence, fractals can take many forms of waves. They can be the same size, be smaller, or follow a specific pattern of various sizes.

For example, a practical example would be an ocean shoreline that has repeating waves and follows similar patterns over a period. Similarly, as you monitor a position changing in the Elliott wave, you will see the pattern reiterating itself. That allows investors to study the market movement through the replicating patterns.
The Elliott wave theory explains that stock prices move in a replicating order due to the investors’ sentiments. It believes that the view of a dominant group of investors dictates the movement of the other individuals in the market.
Hence, the psychology of the majority determines the modifications in the price trends. These patterns repeat themselves when there are altercations in the views of investors, placing stock prices in the category of fractal nature. Meticulous observation can find out about the suitable entry and exit points through these waves.
As per the theory, a rise in price points towards an impulse wave. While a decline in stock price after the impulse wave defines a corrective wave. This pattern repeats itself and leads to sub-waves. For instance, one impulse wave can trigger another five impulse waves at a smaller scale.
How to read Elliott waves?
To read Eliott waves, you need to identify on the chart impulsive waves and corrective waves like on the image below:
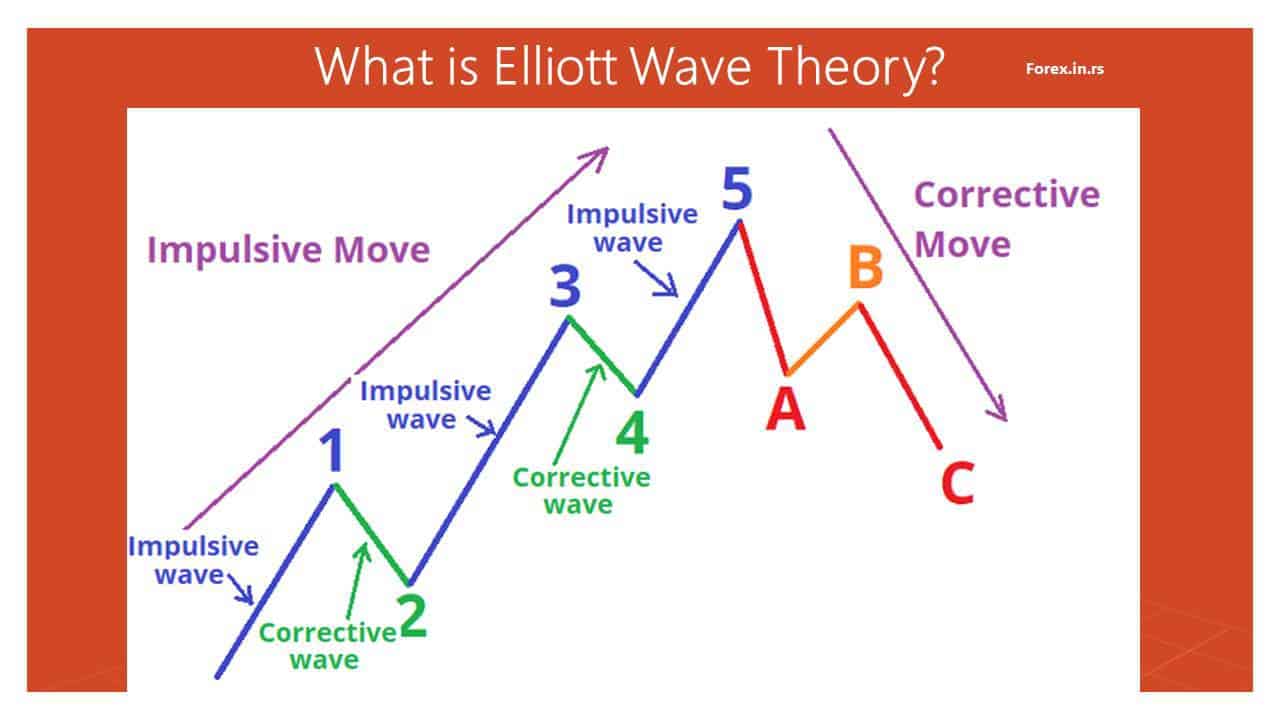
Impulse wave
Wave one: This wave is highly volatile and unpredictable. Since this wave is an onset of the trend strength in the previous time frame. It primarily creates ripples of bad news, negative sentiment, low earnings per share, bearish situations, and negative interpretation of forecasts.
Wave two: The second wave is also negative with bearish sentiments. However, things start to move towards the chirpy side. It is crucial to understand that this wave cannot move past the first wave’s starting point.
The third wave is the most fierce, except the commodities market, which considers the 5th wave the most dominant one. This wave brings positivity in forecasts, sentiments, with high prices and overpowering the bearish outlook of the previous waves.
Wave four: This wave is the onset of the prices moving sideways, with lower trade volumes. Things go back to the normal stage at the end of this wave.
Wave five: The last wave brings bullish sentiments and forecasts. However, the trade volume of this stage is lower than wave three.
Corrective Wave
A: This wave brings positive news for the market. The analysts are still fumbling to find out about the changes while the volume increases and prices stabilize.
B: The stock prices go inverse at a high point. That creates an illusion of the dominance of the bull market. However, the trade volumes become lower as compared to the previous wave.
C: This marks the commencement of the bear market. It symbolizes wave A and has increasing volumes.
These waves can also start at a small scale. For example, waves 1 and 2 have various 1-5 cycles in between, which goes for waves A and C. This leads to the creation of fractal waves.
How to use the Elliott wave calculator?
The Elliott wave calculator traders calculate theoretical price levels for five impulsive waves and three corrective waves based on the previous high, low, close. However, these levels are just price projections, and usually, price levels do not react in actual trading on these price levels.
I do not use Eliott’s wave calculator as a trading tool.
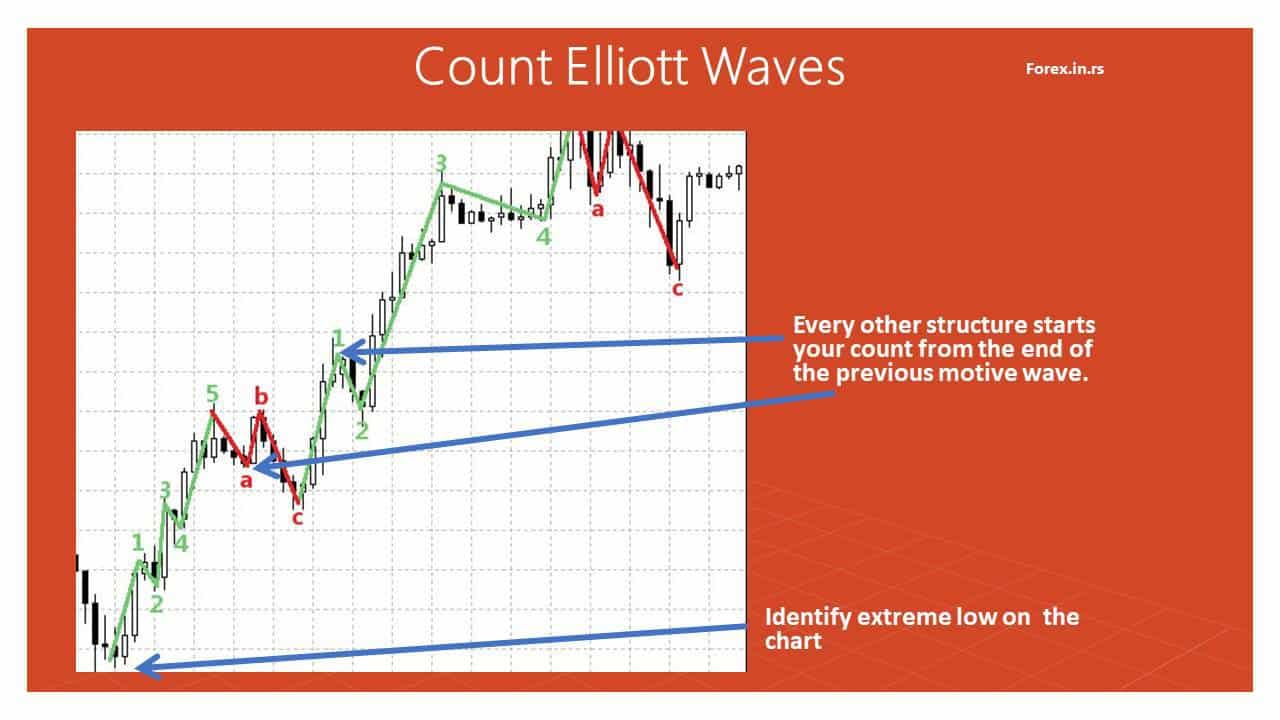
How to start counting Elliott’s wave?
To start Elliot wave count correctly, you need to identify extreme high or extreme low on the chart and to use these excessive prices either as the beginning of impulsive wave one or as beginning corrective wave A. Then, of course, after that, every other structure starts your count from the end of the previous motive wave.
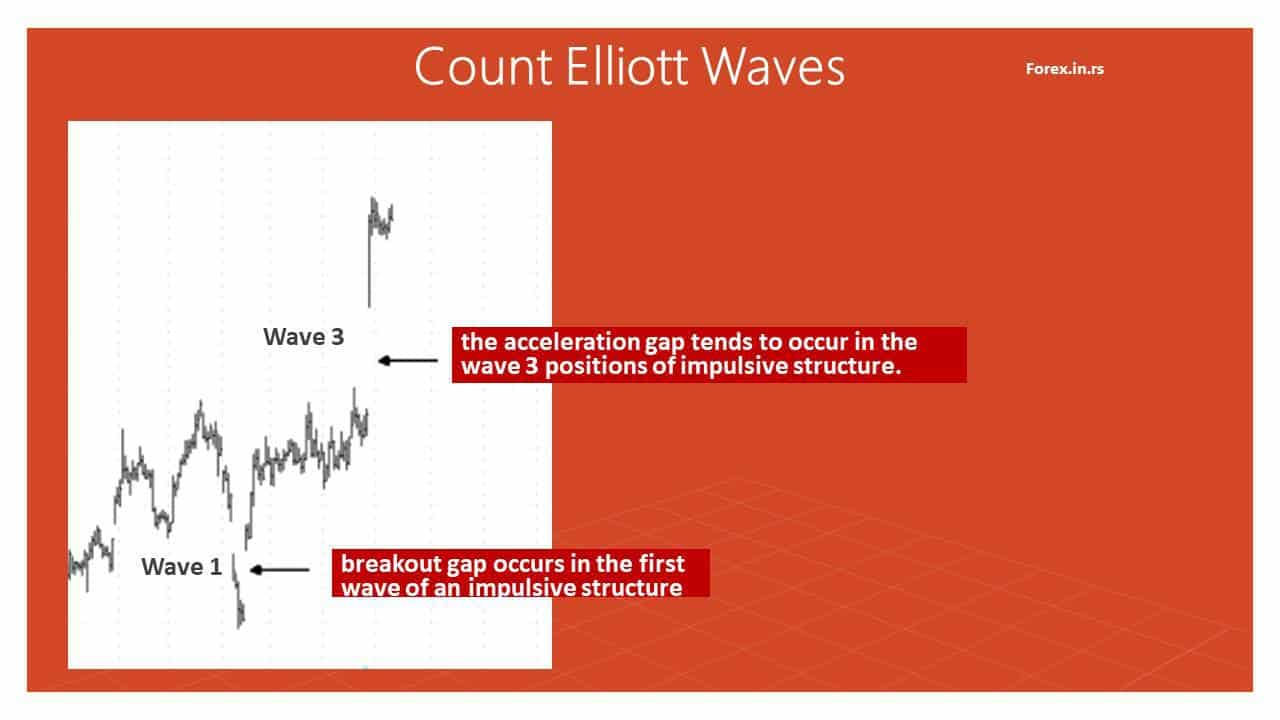
How to use Elliott waves in gap analysis?
However, if you have gaps on the chart, remember that the breakout gap occurs in the first wave of an impulsive structure while the acceleration gap occurs in the wave three positions of impulsive structure.
How accurate is Elliott’s wave theory?
Elliott’s wave is highly accurate in theory but low accurate in practice. For example, wave theory is around 73% accurate when we do classification and want to predict the is next wavelength shorter or longer than previous. However, in practice, Elliott wave systems are around 53% accurate for a 1:1 risk-reward ratio.
Let us explain this:
Using Elliott theo,ry you can identify waves and highly accurately predict if the next wave is shorter or longer than the previous. For example, we know that the 3rd wave will be the longest. However, we do not know in real trading when the previous wave is finished. Therefore, we need to wait to confirm the new trend when we enter into a trade; we are still 50%:50% of what will happen in the future.
To better understand Elliott’s wave, you need to understand it as same as the ZigZag indicator. When you use ZigZag on the chart you think it is 90% accurate. But in practice, you do not know when one wave is finished, and another starts when you enter into trade; your probability is low to guess.
If we enter into the trade after confirmation of the new wave beginning, Elliott wave systems are around 53% accurate for a 1:1 risk-reward ratio based on our systems.
Many people criticize the Elliott Wave theory and claim that it does not apply to stock prices. However, they do not have any substantial proof to support their accusations.
On the other hand, many studies prove that this theory is appropriate and proves its credibility in every case. For example, the “Fibonacci Retracement and Elliott Waves To Predict Stock Market Price” analyst Amman states that the Elliott theory stands true to every pillar. The study, “The Effectiveness Of The Elliott Waves Theory To Forecast The Financial Market,” reached the same conclusion.
Hence, if this theory is practiced judiciously without redacting any step, it can help predict the stock price movements. To rack up good profits, you need to identify and label the patterns precisely. Shabby conduct of the theory can lead to wrong results, indicating that it does not work.
When you study the waves, you can find the patterns and determine price directions. Having a sound understanding of target and stop less provides for favorable investment decisions.
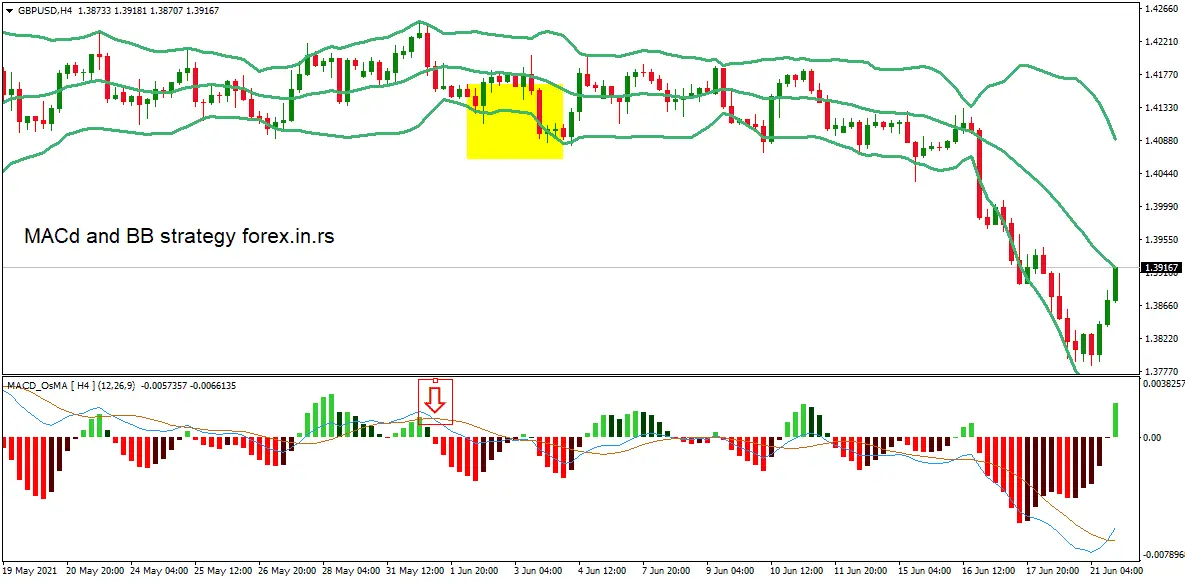
How to identify Elliott wave using MACD?
If you identify waves on the chart and add B. Bands and MA, you can see that wave 3rd is the longest wave because MACD shows the highest or lowest peak within that third wave. So e.MACD divergence can point us to a change in a trend and the end of the current wave.
Wave analysis limitation
Here are some limitations where the wave theory can give false results:
- Patterns can be ambiguous to understand, and even a slight mistake in recognizing the difference can cost you. Hence, understanding it is also a complex process.
- While this theory is accurate, uncertainty is not always there, and hence the situation can take a turn for the worse at times.
- Using only wave analysis will not garner accurate results. It would help if you utilized other financial tools like momentum indicators and moving averages along with the study. Fundamental analysis is also an excellent tool to research the face value of stocks.
Conclusion
Due to the complexity involved, the Elliott theory is hardly used in the stock world. Hence, the rumored notion of the theory is inaccurate.
On the contrary, the veteran traders disagree and say that one can benefit greatly from this theory if used mindfully. For any prediction, you need to understand the basic concepts that blend to make the result. In amalgamation with other tools, this theory can do wonders for price predictions.

He is an expert in financial niche, long-term trading, and weekly technical levels.
The primary field of Igor's research is the application of machine learning in algorithmic trading.
Education: Computer Engineering and Ph.D. in machine learning.
Igor regularly publishes trading-related videos on the Fxigor Youtube channel.
To contact Igor write on:
igor@forex.in.rs
Related posts:
- The Best Elliott Wave Indicator on TradingView
- Download Elliott Wave Indicator
- Wyckoff and Elliott Wave Forex Strategy! – Wyckoff Accumulation & Wyckoff Distribution!
- Is Dow Theory Still Relevant?
- Forex Market Geometry
- How to Start Day Trading?
- Can I Use My Roth IRA to Start a Business?
- How to Create Profitable Trading Setups?
- When Did Forex Start?
- How to Start Forex Trading? – 12 Steps to Master Forex Trading
- EURUSD Live Chart and Price Forecast
- Download Zig Zag Buy Sell Indicator With Alert
