Table of Contents
Volume in trading represents the number of shares, contracts, or lots traded in a security or an entire market during a given period. It measures the strength and interest in a particular price move; high volume often indicates a firm conviction, while low volume might suggest uncertainty or lack of interest. Traders use volume to confirm trends, as significant price movements accompanied by high volume are more likely to be sustainable. Conversely, a low-volume price move might be less reliable, indicating a potential reversal or weakening trend.
Please read our latest article to learn how to calculate pips on Tradingview.


How to Use Volume Profile Indicator on TradingView for Free?
To use the Volume Profile Indicator on TradingView, choose the “Indicators” option in the upper horizontal menu and type. “Volume Profile Visible Range For All Accounts.” The presented indicator can be used on a free TradingView account.
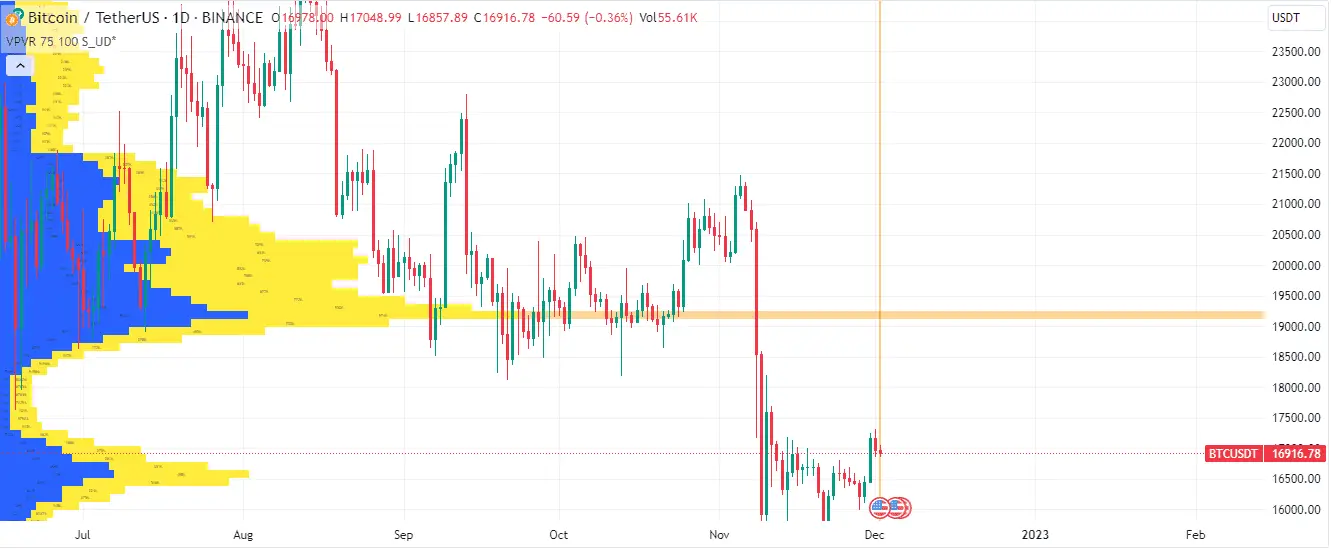
The Volume Profile indicator is a charting tool that displays trading activity over a specific period at certain price levels. Unlike traditional volume indicators that show the volume at a particular time, the Volume Profile shows volume at a particular price level, providing traders with insights into which price levels have seen the most trading activity.

Traders use the Volume Profile to identify potential buying and selling opportunities based on historical trading activity. The rationale is that price levels with high trading activity in the past could also be crucial, providing potential entry points and areas of support or resistance.
See my video:
How can the indicator Volume Profile Visible Range be added to the TradingView chart?
To add the “Volume Profile Visible Range For All Accounts” indicator on a TradingView chart, follow these steps:
- Open TradingView: Start by launching the TradingView platform. If you haven’t already, sign in to your account.
- Choose a Chart: Navigate to a specific market or instrument you wish to view. Once you’ve selected it, you’ll see the respective price chart displayed.
- Access Indicators: At the top of the screen, locate the toolbar. Here, you’ll find an icon resembling a flask or beaker, representing “Indicators & Strategies.” Click on it.
- Search for the Indicator: In the search bar on the left side, type “Volume Profile Visible Range For All Accounts.” As you type, suggestions will appear below.
- Select the Indicator: From the search results, find “Volume Profile Visible Range For All Accounts” and click on it. The indicator will then be applied to your chart.
- Customize the Indicator (Optional): If you want to adjust the settings of the Volume Profile, such as rows, width, position, colors, etc., click on the small gear icon next to the indicator’s name (in the upper part of the chart). This will open a settings menu where you can customize various aspects of the Volume Profile per your preference.
- Analyze: With the Volume Profile now visible on your chart, you can start analyzing the volume at different price levels in the visible range.
- Hide/Remove the Indicator: If at any point you wish to hide or remove the Volume Profile, hover over its name (in the top part of your chart), and you’ll see a small ‘x’ or an eye icon. Clicking the ‘x’ will remove it, while clicking the eye icon will hide it temporarily.
I use the Volume Profile indicator to determine entry and target positions, where volume is the biggest. For stop loss, I choose price level above (sell order) or below (buy order) outside high volume areas, where the previous low or high was in the past.
You can watch my video above.
The Volume Profile indicator is a powerful tool for traders to understand price levels where significant trading activity has occurred. It can be particularly insightful for determining a trading strategy’s potential entry points, targets, and stop-loss levels. Let’s break down how the Volume Profile can assist in setting these three crucial parameters:
- Entry Points:
- The Volume Profile can help identify regions of value in the market. Areas of high trading volume, known as High Volume Nodes (HVN), indicate price levels where many transactions have occurred. These areas often suggest a consensus of value among market participants.
- Conversely, Low Volume Nodes (LVN) represent price levels with little trading activity. LVNs can act as potential breakout or breakdown points, as there’s less consensus or interest at these price levels. A trader might consider entering a trade near an LVN, expecting the price to rush through these areas until it reaches the next HVN.
- Targets:
- As you mentioned, targets are often set within high-volume areas or HVNs. The rationale behind this is that HVNs act as magnets for price. If the price moves towards an HVN, it will likely continue moving until it reaches this value area.
- HVNs can also act as areas of resistance (in an uptrend) or support (in a downtrend). So, suppose a trader is expecting a retracement. In that case, the HVN can be an ideal target, as the price might find it challenging to move past this area due to the substantial trading activity that previously occurred there.
- Stop Loss:
- Placing stop-loss orders above (for short positions) or below (for long positions) HVNs can be a strategic decision. If the HVN acts as a strong support or resistance, then a move past this level might suggest that the prevailing trend is more robust than anticipated.
- Additionally, by placing the stop-loss beyond an HVN, a trader gives the position room to breathe. Minor price fluctuations are less likely to trigger the stop-loss, as the HVN might absorb some price volatility.
- The space between two HVNs, where the LVN resides, can be seen as a “buffer zone.” If the price breaks through an HVN and enters the LVN region, it could indicate a more decisive move in that direction. Therefore, placing a stop-loss just past an HVN can protect against significant adverse moves.
What is the best volume profile indicator in the Tradingview platform?
The best Volume Profile Indicator is “Volume Profile Visible Range For All Accounts” because it is a free indicator with all options with the premium indicator “Visible Range Volume Profile.”
This indicator shows the volume of trades executed at specific price levels. Instead of time-based volume, it’s price-based. This is achieved by summing up the volume based on the estimated transaction price. Since the estimation is based on public volume data, it can be used by any trading account, regardless of its data access privileges.
The goal is to provide insights into where the most trading activity has occurred in the screen’s visible range. This can help traders identify potential areas of support, resistance, and price interests.
Variants of the Volume Profile Scripts:
- Volume Profile For All Accounts: Analyzes several bars, from the last 50 to 20,000 bars. Valid for a broad overview of price-level trading activity.
- Volume Profile From Date For All Accounts: Analyzes trading bars starting from a specific date. Suitable for periodical analysis, such as quarterly or yearly.
- Volume Profile Range For All Accounts: Allows users to select a start and end date to analyze the trading activity within that specific period.
- Volume Profile Visible Range For All Accounts: Focuses on the bars visible on the trader’s screen. This is particularly useful for traders who want to analyze the volume in their current view.
Script Settings:
The settings allow for customization of the visualization:
- Rows: Dictates how many rows (or price levels) the Volume Profile should be divided into.
- Width: Adjusts the width of the volume profile bars. A wider setting might make it easier to see, but it could clutter the chart if too wide.
- Position: Dictates where the volume profile appears on the screen. The abbreviations stand for where the Volume Profile begins and whether it moves up or down first:
- S_DU: Starts at the beginning (left edge) and goes down first.
- S_UD: Starts at the beginning and goes up first.
- BE_DU: Begins just before the end of the visible area, going down first.
- BE_UD: Begins just before the end, moving up first.
- E_DU: Starts at the very end of the visible range, moving down first.
- E_UD: Begins at the end, moving up first.
- Color Settings: Customize the colors of the bars based on their classification.
- Up Volume: Color assigned to the volume associated with upward price movement.
- Down Volume: Color assigned to the volume associated with downward price movement.
- Border: The color of the borders around the volume bars.
- Up/Down separate: If enabled, the up and down volumes will be shown in separate bars.
- Show values: The actual volume figures will be displayed on the bars if enabled.
This tool is invaluable for traders who rely on volume data to make informed decisions. Customizing how the data is displayed allows for a more tailored trading experience. Several scripts ensure traders can analyze volume data in various contexts, depending on their trading strategy and needs.
Conclusion
The Volume Profile visually represents where the most trading activity has occurred over a specified period. By understanding these areas of value and interest, traders can make more informed decisions about entry points, targets, and stop-loss placements. However, like all indicators, combining the Volume Profile’s insights with other tools and analyses is essential to make well-rounded trading decisions.

He is an expert in financial niche, long-term trading, and weekly technical levels.
The primary field of Igor's research is the application of machine learning in algorithmic trading.
Education: Computer Engineering and Ph.D. in machine learning.
Igor regularly publishes trading-related videos on the Fxigor Youtube channel.
To contact Igor write on:
igor@forex.in.rs
Related posts:
- Download Free Hawkeye Volume MT4 Indicator! – How to read Hawkeye volume indicator?
- Download Market Profile Indicator
- How to Backtest on TradingView? – Free Strategy Scripts Without Coding
- Download MT4 Volume Indicator – Better Volume Indicator
- The Best Elliott Wave Indicator on TradingView
- The Best Buy Sell Signal Indicator in TradingView!
- Volume Weighted Moving Average Indicator
- MBFX Timing Indicator – Free download MT4 Indicator
- Volume Weighted Average Price VWAP Strategy – VWAP indicator for Nifty
- Trend Reversal Indicator Free Download! – Lucky Reversal Diamond Indicator
- How Much is the Forex Market Volume Per Day? – Forex Daily Trading Volume!
- Vertex Mod Indicator – Free Download Vertex Mod No Repaint Indicator
