Table of Contents
Bullish and bearish structures on the charts include triangles, where the price consolidates within a narrowing range before breaking out upwards/or down, signaling a potential continuation of an uptrend or downtrend.
Trendlines, drawn by connecting the lows in an uptrend or the highs in a downtrend, help identify the overall market direction and areas where price reversals may occur. Support and resistance levels are horizontal lines representing the prices at which a security has difficulty moving, with support indicating a lower boundary where buying is strong enough to overcome selling pressure and resistance marking an upper limit where selling outweighs buying.


Various patterns, such as head and shoulders, cup and handle, or flags, can also provide insights into market sentiment and future price movements. Each pattern has its implications for continuing or reversing trends. Understanding these elements on a chart can significantly enhance the ability to make informed predictions about future market behavior, particularly in spotting opportunities to enter bullish markets.


What is the Break of Structure in Forex Trading?
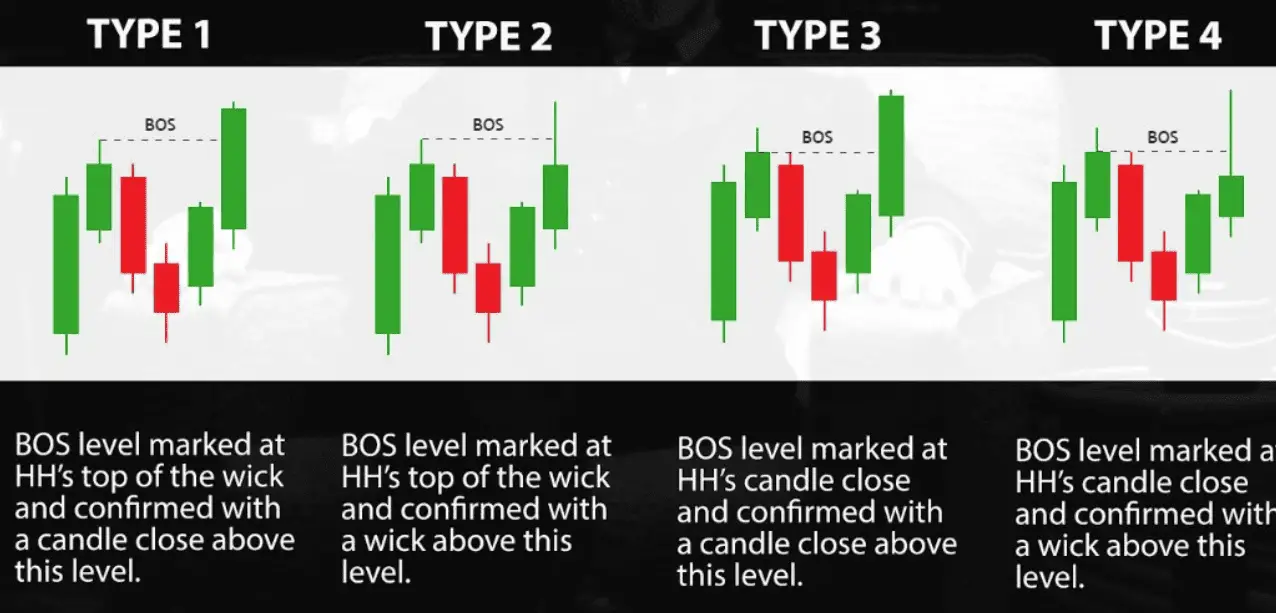
The break of structure in trading represents any interruption of a bullish or bearish trend structure on the chart, after which a new trend occurs. For example, if the price breaks a triangle or up-down bullish/bearish pattern, we can see a typical structure break. Structure break starts with the candle close above or below the previous structure.
In ICT trading strategy, for example, a break of structure can type 1,2,3,4, like in this image:
Triangle Pattern Break Of Structure Example
The Triangle Pattern Break of Structure (BOS) is a pivotal event in technical analysis that signals a potential shift in market direction. This pattern is formed when the price of an asset consolidates within a converging range, creating a triangle shape on the chart. The triangle can be ascending, descending, or symmetrical, indicating different market sentiments. A Break of Structure occurs when the price decisively moves out of the triangle pattern, breaching the support or resistance line that forms the triangle’s perimeter.

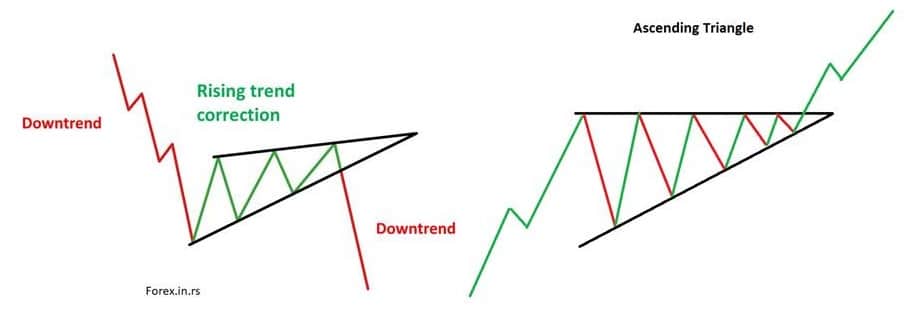
This breakout is significant as it suggests that the market has gathered enough momentum to break away from its previous equilibrium, potentially leading to a new trend. Traders often wait for this BOS as a confirmation to enter trades, relying on volume and follow-through movements as additional indicators of the breakout’s strength and sustainability.
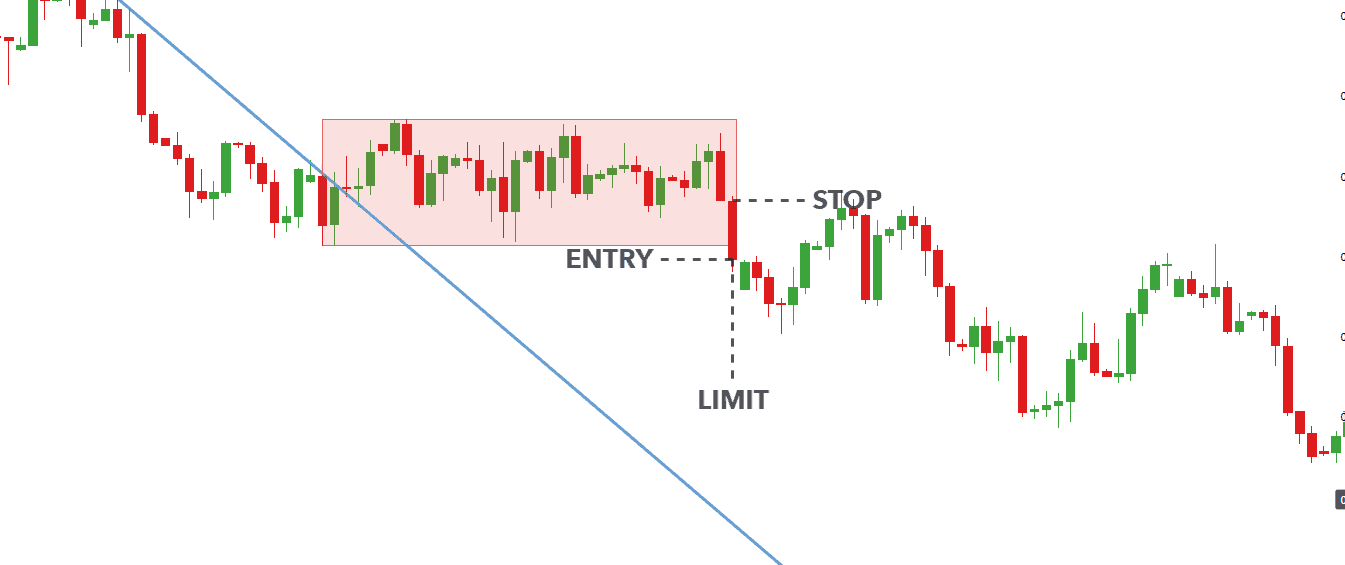
Rectangle Pattern Break of Structure
The rectangle pattern in technical analysis is a continuation pattern that forms when the price of an asset moves within a horizontal range bounded by parallel support and resistance levels, indicating a consolidation phase. This pattern is identified by two roughly equal highs and two equal lows, creating a rectangular shape on the chart.
A break of structure occurs when the price finally moves out of the rectangular consolidation zone, signaling the continuation of the prior trend. If the breakout is upward past the resistance level, it suggests a continuation of the bullish trend; conversely, a downward breakout through the support level indicates a continuation of the bearish trend. The validity of the breakout is often confirmed by increased trading volume, providing traders with a signal to potentially enter or exit trades based on the direction of the trend continuation.
Support and Resistance Break of Structure Example
A Support and Resistance Break of Structure (BOS) is a critical concept in technical analysis. It signals a shift in market dynamics and potential trading opportunities. Support levels are prices where buying interest is significantly strong enough to overcome selling pressure, leading to a pause or reversal in a downtrend. Conversely, resistance levels are prices where selling interest overcomes buying pressure, pausing or reversing an uptrend.
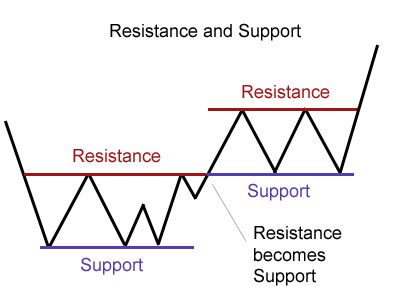
A Break of Structure occurs when price action decisively breaches these levels, indicating a significant change in market sentiment and balance between buyers and sellers. For a BOS to be considered valid, the price must cross these levels and close beyond them, often accompanied by increased trading volume for confirmation. This event is pivotal for traders, as it may signify the beginning of a new trend or the continuation of an existing trend, prompting them to adjust their positions accordingly.
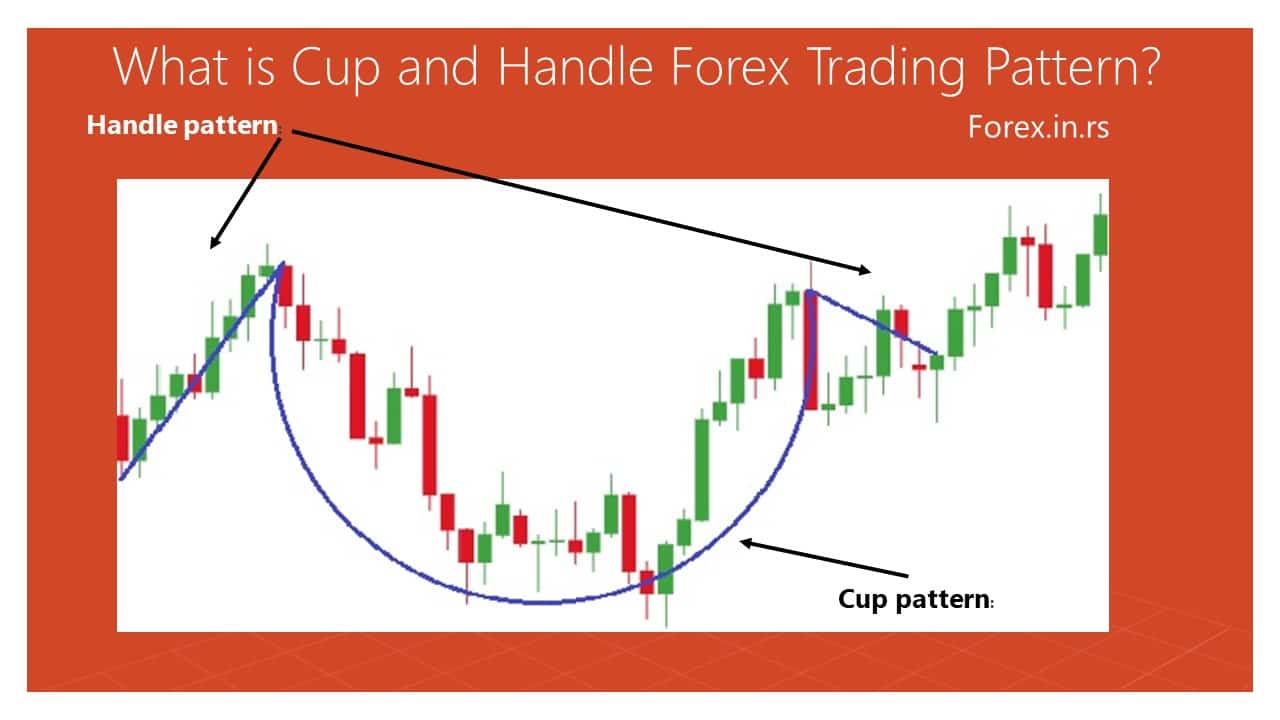
Cup and Handle Break of Structure
As we know, Cup and Handle represents a bullish continuation pattern resembling a teacup on a chart that signifies a period of consolidation followed by a breakout. The “cup” forms after a price drop and subsequent rise to the original level, followed by a smaller “handle” period of consolidation and an upward breakout.
Double Top and Double Bottom Break Of Structure
The concepts of “double bottom” and “double top” are technical analysis patterns used in trading to identify potential reversals in market trends. These patterns are observed on charts of asset prices, and they signal the potential end of a trend and the beginning of a new movement in the opposite direction. Let’s break down each pattern:
Double Bottom
A double-bottom pattern is a chart formation that signifies a reversal in a downtrend. It is characterized by the price of an asset reaching a low point twice with a moderate rise in between, failing to break lower on the second attempt. This pattern suggests that selling momentum is diminishing, and a potential change to an uptrend could be forthcoming.
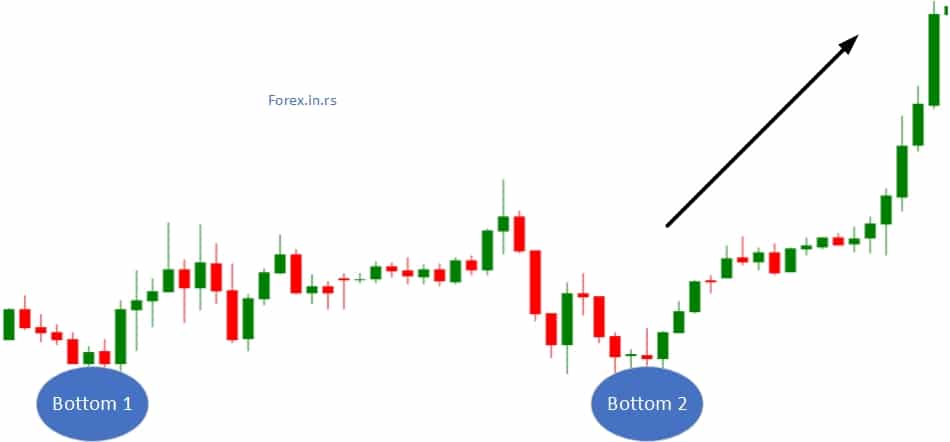
Here’s how it works:
- First Trough: The asset’s price reaches a low point, then bounces upward.
- Pullback: Following the bounce, the price faces downward pressure but does not make a new low, indicating that the selling momentum is weakening.
- Second Trough: The price then falls back to a level close to the first low point, creating a second trough. Importantly, this second trough should not go significantly lower than the first, indicating strong support at this level.
- Breakout: The double bottom pattern is confirmed when the price breaks above the resistance level formed by the peak between the two troughs. This breakout often accompanies increased volume, signaling a potential trend reversal to the upside.
Double Top
A double-top pattern is a chart formation that indicates a reversal in an uptrend. It is characterized by the price of an asset reaching a high point twice with a moderate decline in between and failing to break through on the second attempt. This pattern suggests that the buying momentum is weakening, and a potential change to a downtrend could be imminent.
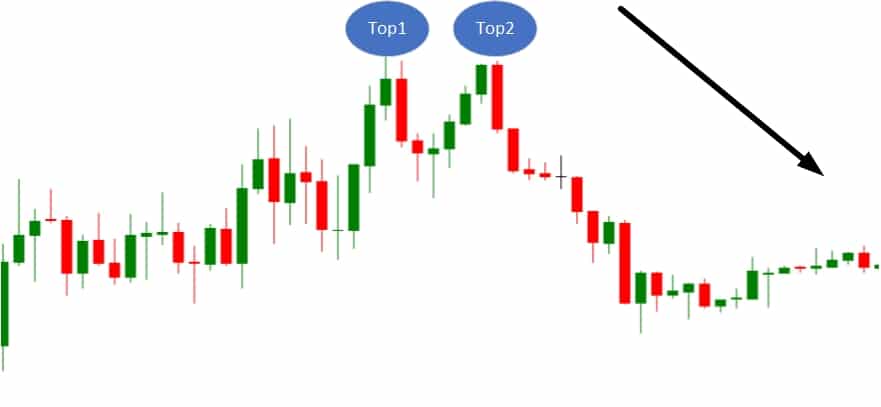
Here’s the sequence:
- First Peak: The asset’s price reaches a high point and then experiences a pullback.
- Rally: After the pullback, the price moves up again but fails to break significantly above the first peak, creating a second high point close to the level of the first peak. This suggests that the buying momentum is losing strength.
- Second Peak: The inability to push higher on the second attempt forms the second peak, indicating resistance at this level.
- Breakout: Confirming the double-top pattern occurs when the price breaks below the support level formed by the trough between the two peaks. Like the double bottom, this breakout is preferably accompanied by increased volume, indicating a potential trend reversal to the downside.
Flags and Pennants Breaks Of Structure
Flags and pennants are short-term continuation patterns that appear in markets undergoing a strong trend. They represent a brief consolidation before the trend continues. A flag pattern is characterized by a small rectangular shape that slopes against the prevailing trend direction, formed by parallel trendlines that act as support and resistance.
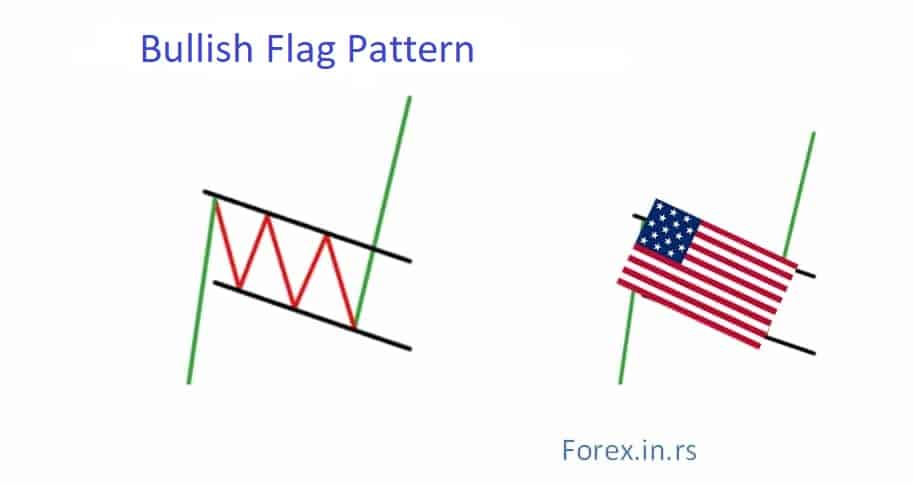
A pennant, on the other hand, is a small symmetrical triangle that forms right after a sharp movement in price, with the consolidation having converging trendlines. The break of structure in both patterns occurs when the price breaks out of the consolidation area (the flag or pennant) and resumes the previous trend direction. This breakout, typically accompanied by increased volume, signals traders to expect a continuation of the trend that was in place before the pattern formed.
Trend channels Break Of Structure
Trend channels are technical analysis tools used to depict the direction and volatility of price movements within two parallel trendlines: an upper line connecting the highs and a lower line connecting the lows. These channels can be upward (bullish), downward (bearish), or horizontal (sideways) and illustrate the range in which an asset’s price is trading over a specific period.
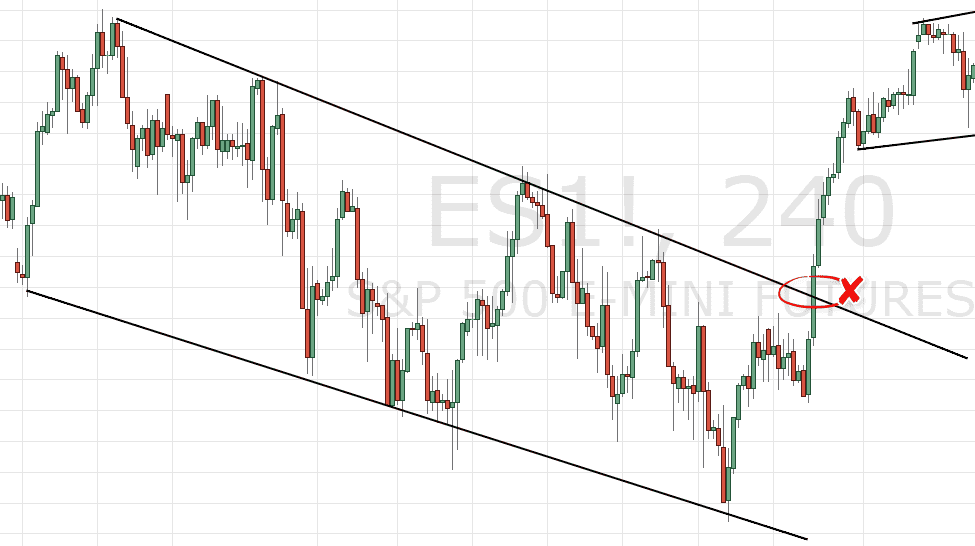
A break of structure occurs when the price of the asset breaks through one of the channel’s boundaries, indicating a potential change in the trend or an acceleration of the current trend outside of its previous volatility range. For a bullish channel, a break below the lower trendline may signal a reversal or weakening of the uptrend. Conversely, a break above the upper trendline in a bearish channel might suggest a reversal or weakening of the downtrend. This breakout or breakdown from the trend channel is significant for traders as it may indicate a shift in market sentiment and can be used as a signal to enter or exit trades.
Conclusion
A Break of Structure (BOS) in the context of technical analysis signifies a notable shift in market sentiment and trend direction, often as a precursor to trend reversals or continuations. This phenomenon occurs across various chart patterns, including double tops and bottoms, rectangle patterns, flags, pennants, and trend channels, each providing unique signals based on the pattern’s context.
Confirming a BOS, typically through a definitive price movement beyond crucial support or resistance levels, coupled with increased volume, lends credibility to the anticipated change in trend. For traders and investors, recognizing a BOS is crucial for making informed decisions about entry and exit points, effectively managing risk, and capitalizing on potential market movements. Ultimately, while a BOS is a powerful tool in technical analysis, it should be used with other indicators and analysis methods to validate trading strategies and increase the likelihood of successful outcomes.

He is an expert in financial niche, long-term trading, and weekly technical levels.
The primary field of Igor's research is the application of machine learning in algorithmic trading.
Education: Computer Engineering and Ph.D. in machine learning.
Igor regularly publishes trading-related videos on the Fxigor Youtube channel.
To contact Igor write on:
igor@forex.in.rs
