Table of Contents
Traders use various indicators to get an edge, and a better perspective, to find the right moment and price level to enter into trade. However, some indicators can give you the wrong point of view, a much prettier picture than the real one.
What does “repainting” in Forex mean?
Repainting in the forex is a term that represents the trading platform indicator that repainting (lagging), meaning that indicator changes display on the chart as new price data (candles/bars) comes in. A repainting process shows that the indicator displayed on the chart is highly accurate when it is not.


Please see the example of a lagging repainting indicator that I created in a youtube video:


Let us see now what is repainting indicator means:
Repainting indicator
The repainting indicator changes its value as an indicator repositioning its line at the point where the current price bar is forming. Such indicators take the help of future data to bring forth the values and signals for entry. In this way, repainting indicators ensure their exit and entry signals in the past look highly accurate and has zero error. Thus, the repainting indicator looks accurate on the chart, but in actual trading, they are not.
See below how the repainting indicator example looks on the chart:

Non-repaint indicator meaning
Non-repainting indicators show buy or sell arrows (signals) when the bar is closed or when the trigger condition occurs without repositioning. The non-repainting indicators may not look accurate on the chart, but they show actual entry price levels in real trading.
Example: Renko Super Signal Repaint Indicator (Renko Super-signals_v3 double repaint indicator)
Image 1: Renko Super Signal Repaint Indicator touch high channel
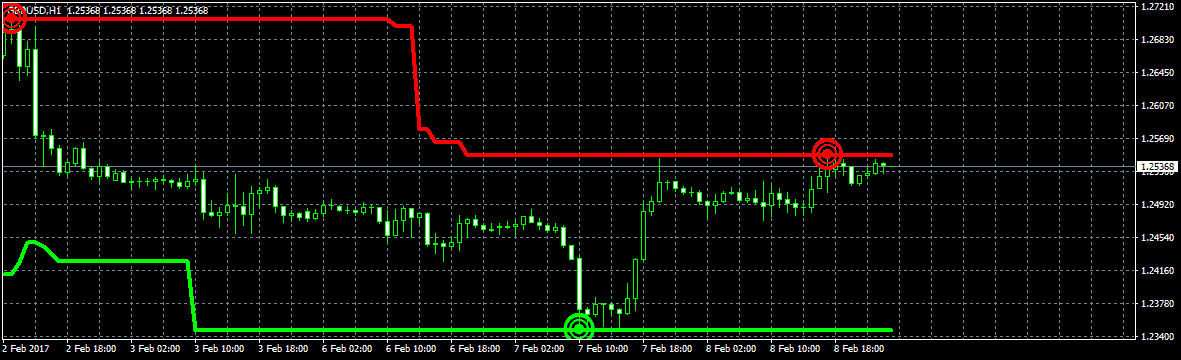
Image 2: After a couple of hours, the price goes up. The indicator will delete the green circle and create a new one representing high.
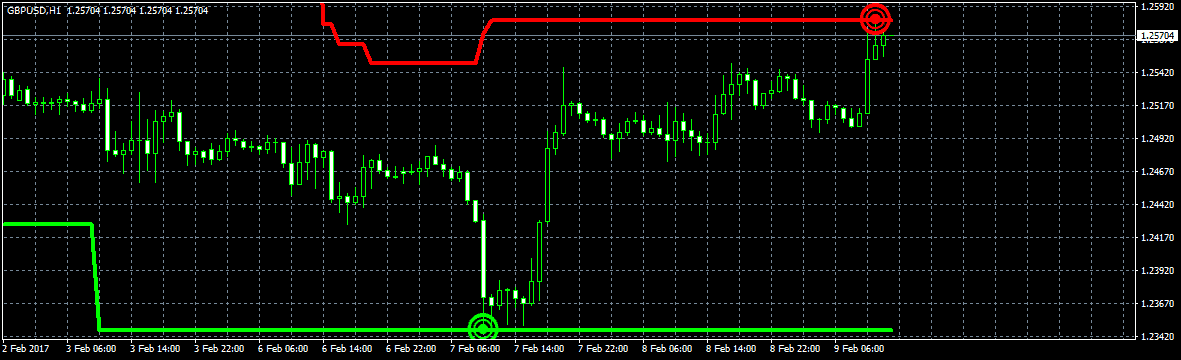
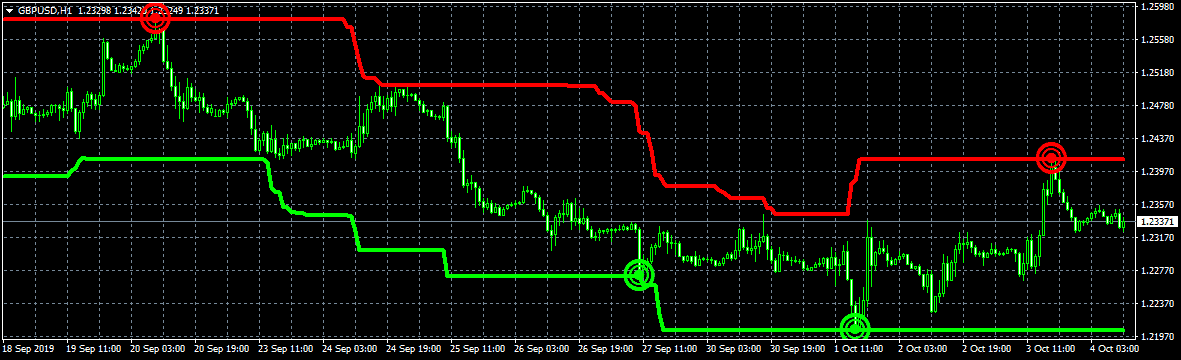
Image 3: When we look at the chart, everything is perfect – the indicator shows high and low perfectly. This is a false look because there are a lot of highs and lows that we can not see – we see only perfect ones:
Below you can free download from our site: Super signal indicator no repaint.
What is Repainting in Forex All About?
Forex traders use technical indicators as guidelines in forecasting and taking the appropriate conclusion. Unfortunately, in many cases, traders tend to use indicators rather than misdirect them.
Today, scammers abound everywhere on the Internet and wait to catch prey on ill-informed product buyers. As a result, many indicators are sold, promising to bring superb results, which are finally found to be schemes of fraudsters.
This article seeks to explain the query that is repainting in the forex. Many fraudsters use the notion of repainting. Repainting renders indicators attractive when studied on illustrating the charts. It’s not a case of live trading. To bring clarity, we’d differentiate the repainting indicator from the non-repainting indicators.
Forex indicators differentiated
The figure shows the indicator recalculating its value according to the current price. As a matter of standard practice, this indicator continuously emits false signals, not reflecting any past chart. The indicator is, for instance, likely to emit five signals, and of these, three are wrong. They go out of sight later, keeping only two signals for entry.
The given illustration shows entry signals and trade completely open. Now consider the following figures having the BUY signals gone out of sight and following a few bars.
The figure shows the trader having closed the BUY signal (previous) and seems to have followed a particular BUY & SELL pattern. Both SELL and BUY signals go out of sight and are not shown by the chart. Thus, it looks as though those traders were logical. However, this repainting indicator based on MT4 made the trader a fool.
However, repainting doesn’t mislead anyone. We will see how it is thus:
The current price bar moving average, for instance, keeps adjusting according to the changes in price. However, when the bar comes to loss, the average will ceases undergoing any difference about the closed bar. The core idea is not to be selective about the price indicators, whether moving forward or lagging. This indicator generally becomes static when the price bar comes to a close. This will bar the indicator formation or fluctuation after the price closure.
However, it is not in repainting indicators because values keep changing on closed bars while dealing with repainting indicators. Therefore, these indicators generally apply bars at the right when estimating the values.
While an indicator that is non-repainting is expected to use the prices in estimating the values, the indicator should not change at all. For example, the opening price remains constant when a bar becomes open. Therefore, the indicator needs to re-estimate the values.
For instance, if open prices are used to determine moving averages, repainting should not happen as only one available price per bar (is acceptable), and will not change. However, it is not involving repainting indicators.
In a few instances, many indicators are generated to estimate high, close, low, or high prices. In these instances, the indicator tends to repaint the formation of new bars happens. This is because the relevant indicator must consistently apply the current price to match the close, high, or low price until the bar closes. As the price rises and falls, new lows and new highs are formed, ultimately closing the price. Thus, the indicator continues to repaint up to the bar’s closure. For instance, if 10 SMA is applied to the bar on the five-minute chart, the MA tail will rise and fall until the bar’s closure.
Good, and bad indicators are distinguished.
As discussed in the article, it’s important to note that repainting indicators are wrong. In other words, you can find good repainting and bad indicators. Good indicators like the fractals and the zigzag do not aim to deceive users.
As a trader, you need to learn the way to use indicators. Zigzags and fractals enable traders to spot specific patterns. Thus, they go on changing as prices fluctuate. The bottom line is that you are not supposed to impose a model to build up; the indicator must follow the price until the pattern’s formation.
How to differentiate good repaint indicators from bad ones?
First, it’s essential to be careful while dealing with indicators. Theif repainting indicator creator does not ask the users about it; the odds are high; it’s a bad one, and users become fools. On the other hand, an indicator creator lets the users know all the valuable facts about the indicator.
Elsewhere, the indicator is likely to manifest some signals indicating entry, which goes out of sight after some time with prices moving in the reversed direction. It’s an unambiguous indication of repainting indicators badly. This makes it unreliable. The entry signals should not go out of sight when they manifest by the chart. All the signals at entry from the indicator need to be visible on the chart to assess how reliable the indicator is.
A relevant example is when the indicator gives the signal for a ‘buy,’ you should decide to get started once the indicator can show that it could sell and determine to sell. However, the signal you’re likely to get and the indicator you choose to follow may go out of sight because that was a counterfeit signal. This subjects your trade to bear losses, and you might be hard-pressed to close the trade or possibly look for the forthcoming indicator that is likely to be promising. This is likely to happen often and may result in unpredictable losses and boredom, mainly if you’re working on minor time frames.
When they go out of sight when there is a false signal of entry, it creates a fake visual impression for any trader who generally takes things for granted to become interested in this particular indicator. It happens because the situation looks close to all performing at exit and entry points. The indicators consider the bar prices shown on the right.
Fractals – a quality repainting indicator
In the course, when fractals fluctuate, some signals may vanish, which is fine. Fractals are built from five bars. The top bar generally comes down in the middle for fractals because the two bars aside from the lower highs are close to the center.
In fractals down, the bar at the lowest level will come in the middle, whereas the successive two bars will come up on both sides. Thus, the two bars at the end appear to form the fractal sign. In a few cases, the fourth or the fifth bar will likely increase or decrease and become less than the middle one. It, thus, makes the odds of fractal down and fractal up fewer. The indicator’s sign vanishes in such an instance, but it does not mean it’s that bad.
This only indicates that the fractal was not formed. Once the five-bar pattern is built correctly and the fifth bar ends, the signal is visible. The fractal is a powerful indicator of success when traders are aware of its working mechanism.
ZigZag – the other good quality repainting indicator
The zigzag indicator continues repainting. It is the way it is supposed to function. The zigzag indicator comes to play its role when a particular stock or security is about going in a reverse direction. The lows, highs, waves and swings, new lows, and new highs are built, as it’s evident. This indicator adjusts accordingly to show the change. In such a case, the indicator changes similarly to prices.
How does terrible repainting deceive traders?
Bad repainting indicators generally fire signals and reestimate their values subsequently with bars’ aid at the right. Should the signals that manifested be wrong, they will go out of sight in the chart a new signal is likely to be given. When users perspective the performance track record of such indicators, it shows the entry signals to be perfect. However, strictly speaking, every genuine signal goes out of sight fast.
The second significant point is that a poor repainting indicator usually considers perfectly the extent of resistance and support. But the indicators continue to adjust the levels when there is an instance of a high new price form. So the users of these indicators will do the job wrongly to find that the level changed when there was a price change.
Indicators of lousy repainting tend to use the data for the future (suitable bars) to come up with values. It is aimed to trick the users into ensuring charts of the past are replete with excellent points.
Hot to check the repainting indicator?
- Use strategy tester MT4
- Perform a backtest for selected indicators.
- To check the result faster, use a small time frame.
- Keep values of the non-repainting indicator unaltered after the price bar closure.
- The values of repainting indicators are mentioned on price bars already closed.
How to gauge the quality of indicator repainting?
Traders use several ways to check whether the indicator used is worth it. The MetaTrader strategy is among the most widely used ones. You can easily access the strategy-tester from the platform of meta trade from the menu atop. Fill in the data, including the indicator you wish to test, and the date, period, and range in which it will be checked. Then, with the right speed, the users can try the indicators. In addition, you may mark and record screenshots to make a comparison between after and before charts.
It is important to note that when performing the testing, use a lower period. In such a case, you can get the results quickly. For example, five minutes or just one minute will enable you to get results faster than four hours. Note that testing has to be done in the right place because it may miss a few details if it is too fast. Further, you are likely to lose focus even if it is lower. The MetaTrader’s meter will help in adjusting to the appropriate speed. And, the rate should be the right one – neither too slow nor too fast.
If the indicator’s values continue to change concerning closed bars, you need no repainting indicator. Keep values of non-repainting indicators unaltered and on all the closed bars. If you wish to replace the values as price bars close, that is no other than a repainting indicator. In the same way, if signals are not found on your chart.
I am stopping indicator repainting – how do it?
The lone way to execute it is reprogramming. In some situations, it might involve a few code lines, and at times the site could be a complex job. In such cases, the indicator is recoded to stop using bars on your right; you will make a non-repainting indicator (standard). It is not the identical indicator that shows mostly losing entry signals alone; once it’s changed into non-repainting indicators.
A wrap-up
In reality, non-repainting indicators bring fewer problems. Of course, IN most cases, they tend to lag. They are valuable because of a lot of information they carry. The report doesn’t alter. It is probably beneficial to refer to the charts of the past. However, the reliability and the attribute used with other indicators make them more reliable. Few traders find it helpful to have indicators of this type. These indicators reveal that the past track record is pretty good, and traders tend to think they can reach the goal. However, the reality is that everything is not the same as it was before.
In the end, when hearing “What is Repainting in Forex ?” most trades think only one thing – something terrible. Traders like to see false signals when testing indicators or Ea to see the accurate picture.

He is an expert in financial niche, long-term trading, and weekly technical levels.
The primary field of Igor's research is the application of machine learning in algorithmic trading.
Education: Computer Engineering and Ph.D. in machine learning.
Igor regularly publishes trading-related videos on the Fxigor Youtube channel.
To contact Igor write on:
igor@forex.in.rs
