Table of Contents
Amazon, founded by Jeff Bezos in 1994, went public in 1997 with an initial public offering (IPO) price of $18 per share. Today, Amazon is one of the world’s most valuable companies, with a market capitalization of over $1.6 trillion as of May 2023. Despite experiencing periodic dips and surges, Amazon’s stock has been one of the best-performing stocks over the past decade, generating a return of over 900% from 2011 to 2021.
Amazon’s stock price today USD chart


Amazon Financials in 2024 used for stock prediction.
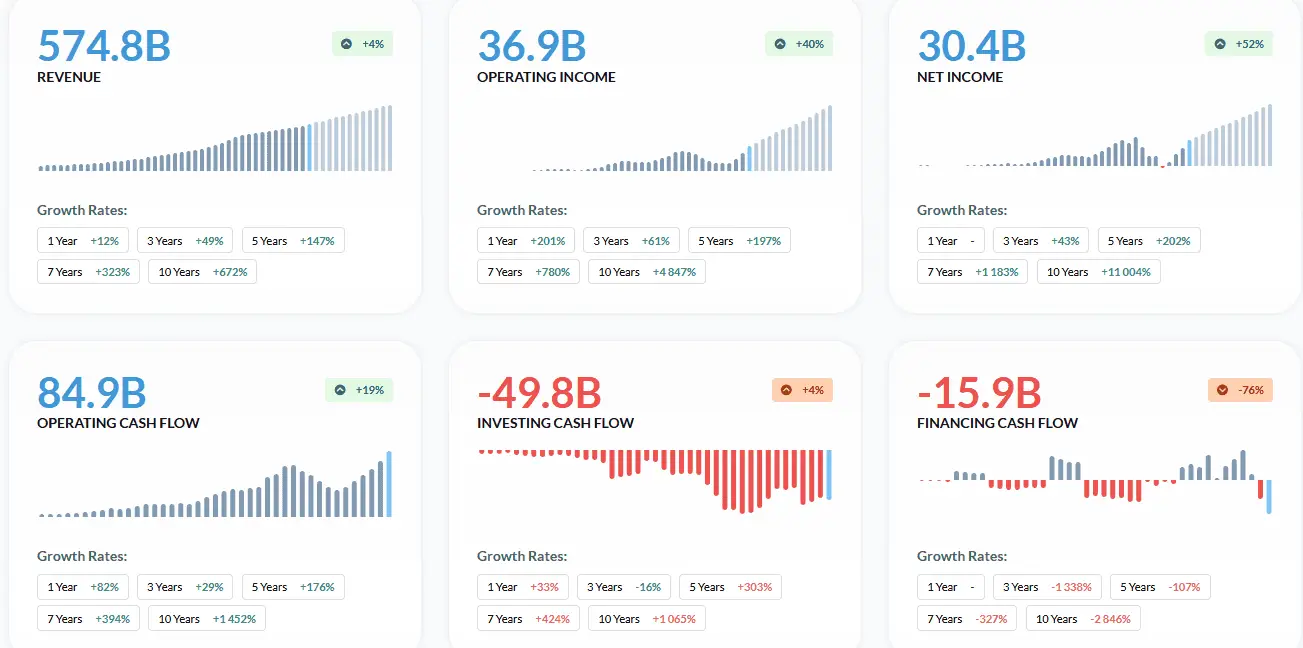
Amazon Stocks Facts in 2024:

- Amazon.com’s stock has significantly increased, rising by 22% over the past three months, prompting a closer examination of its financial health and indicators, particularly its Return on Equity (ROE).
- ROE is a critical financial metric that measures how effectively a company’s management is using its capital to generate profits, providing insights into the profitability of shareholder investments.
- The formula for calculating ROE is Net Profit divided by Shareholder Equity. For Amazon, the ROE is calculated as 15% based on the trailing twelve months to December 2023, with net profits of $30 billion and shareholder equity of $202 billion.
- This 15% ROE means that for every dollar of shareholder equity, Amazon generates $0.15 in profit, indicating a robust utilization of equity.
- ROE not only reflects current profitability but also helps predict future earnings growth depending on how much profit a company retains and reinvests back into the business.
- Although Amazon’s ROE is commendable at 15% and aligns closely with the industry average of 16%, its net income growth of 5.7% over the past five years is below the industry average growth rate of 14%.
- The lower growth rate compared to the industry suggests that while Amazon is efficient at generating profit from its equity, there are other factors impacting its overall earnings growth relative to its peers.
- Amazon has not been distributing dividends, implying that it reinvests all its profits back into the business, aiming for expansion and operational enhancements.
- Amazon’s overall performance is strong, especially in terms of its reinvestment strategy and ROE, which have contributed to respectable earnings growth despite lagging behind industry growth rates.
- According to industry analysts, future earnings are expected to accelerate. Potential investors should consider current performance metrics like ROE and projected earnings growth to evaluate Amazon’s stock value accurately.
Amazon Stock Forecast
Companies heavily dependent on consumer spending, such as Amazon, may experience a slowdown in sales and revenue growth during an economic downturn.
Amazon’s online store revenue fell slightly in 2023 compared to the previous year despite overall net sales growth, which may indicate that the company faces increased competition and saturation in the online retail space. However, it is also possible that consumer behavior shifted towards other retail forms, such as brick-and-mortar stores, during the pandemic.
As one of the world’s largest and most well-known companies, Amazon has a market capitalization of trillions of dollars. Various factors, including global economic conditions, company-specific news, and investor sentiment, can influence its stock price.
It is also worth noting that growth stocks, including those of large companies like Amazon, can experience significant price swings in response to changes in market conditions, as evidenced by the 51% decline in Amazon’s stock price in 2022. Again, this highlights the importance of diversification and a long-term investment strategy when investing in growth stocks.
Amazon Stock Forecast 2025
Based on Amazon’s 5-year forecast using the ensemble ML model, Amazon’s stock price prediction for 2025 is $85 (end of the year).
Please read a separate article about Amazon’s stock prediction for 2025.
Amazon Stock Forecast 2030
Based on Amazon’s 1997-2023 forecast using the ensemble ML model, Amazon’s stock price prediction for 2030 is $280 (end of the year).
Please read a separate article about Amazon’s stock prediction for 2030.
Amazon Stock Forecast 2040
Based on our regression model, Amazon’s stock price prediction for 2040 is $860 (end of the year). Compared with the last decade’s average price, future Amazon stock prices can achieve an 8.5 times price increase in the next 17 years.
The ensemble ML model predicts that Amazon’s stock price will be $860 at the end of the year 2040. This represents an 8.6 times price increase compared to the 2023 average price. The prediction considers various factors, including Amazon’s corporate earnings, revenue, debt levels, economic indicators, daily price levels from 1997 to 2023, RSI indicator values from 1997 to 2023, technology industry trend rating, and competitive landscape rating.
The ensemble model used in the prediction combines the strengths of three methods: ARIMA, SVMR, and Random forest. ARIMA captures the underlying trend and seasonality in the time series data, while SVMR and Random forest capture any remaining patterns in the data that ARIMA may have missed. Finally, the predictions from all three models are combined using an ensemble method to create the final prediction.
Amazon stock forecast 2040. Methodology
To make an Amazon stock price prediction for 2040, we analyzed the price range between 1997 and 2023. We use multiple features for price prediction in combination with technical and fundamental analysis.
However, it is very hard to predict future prices because markets change, and over a long time span, the whole industry can change.
Amazon stock prediction features that impact a stock’s long-term price are:
- Amazon corporate earnings: A company’s revenues, or profits after all expenses, can significantly impact the stock price. Higher earnings can lead to higher stock prices, while lower earnings can cause stock prices to fall.
- Amazon company revenue: A company’s revenue, or the amount of money it earns from sales, is another critical factor impacting its stock price. If a company’s revenue grows, its stock price may rise, while declining revenue can cause the stock price to fall.
- Amazon company debt: A company’s debt level can also impact its stock price. High debt levels can make investors nervous, as it may be difficult for the company to repay its debts and continue to grow.
- Economic indicators: Economic indicators, such as GDP growth, inflation, and interest rates, can also impact an Amazon stock’s long-term price. A strong economy can lead to higher stock prices, while a weak economy can cause stock prices to fall.
- Amazon’s daily price levels from 1997 up to 2023. : Price levels
- RSI indicator values from 1997 up to 2023: Values from 0 to 100
- Technology industry trend rating: custom indicator from 0 to 100
- Competitive landscape rating: customized hand from 0 to 100
Predicting stock prices is a challenging problem that requires analyzing large amounts of data and identifying complex patterns. One approach to improving the accuracy of stock price prediction is to use an ensemble model that combines the strengths of multiple machine learning methods. For example, a hybrid model combining ARIMA, support vector machines regression, and random forest ML methods has been used to predict Amazon stock prices.
ARIMA (Auto Regressive Integrated Moving Average) is a statistical method that can model time series data, including stock s. It uses a combination of autoregression (predicting future values based on past values) and moving averages (smoothing out noise in the data) to make predictions. Support vector maes regression (SVMR) and random forest are machine learning methods that can capture complex relationships in the data and make accurate predictions.
The hybrid model begins by applying ARIMA to the time series data to capture its underlying trend and seasonality. The residual errors are then fed into SVMR and random forest models, which can capture any remaining patterns in the data that ARIMA may have missed. The results from each model are combined using an ensemble method to make the final prediction.
This hybrid model’s advantage is that it can capture both the linear and nonlinear relationships in the data and handle the noisy and non-stationary nature of stock prices. Moreover, the ensemble method can help reduce the impact of any individual model’s weaknesses or biases, leading to improved accuracy.
An ensemble model is a machine-learning technique that combines the predictions of multiple models to improve accuracy and robustness. In the context of stock price prediction, combining the strengths of different models to capture both linear and nonlinear patterns in the data can be beneficial. This is where an ensemble model combining Random forest, SVR, and ARIMA comes in.
The ensemble model combines the three methods to create a more accurate and robust prediction model. The approach begins with applying ARIMA to the time series data to capture its underlying trend and seasonality. The residual errors are then fed into the SVR and Random forest models, which can capture any remaining patterns in the data that ARIMA may have missed. The predictions from all three models are then combined in some way (e.g., averaging or weighted averaging) to create the final prediction.
The advantage of this ensemble model is that it forecasts both the linear and nonlinear relationships in the data and handles the noisy and non-stationary nature of stock prices. Additionally, the ensemble method can help to reduce the impact of any individual model’s weaknesses or biases, leading to improved accuracy and reliability.
Conclusion
In the next 17 years, we can expect Amazon’s stock price to rise. However, the rising trend will not be linear, and we can expect the next few years of recession and price decline.
It’s important to note that stock price prediction is inherently uncertain, and many factors can impact Amazon’s stock price between now and 2040. The forecast is based on historical data and assumes that future trends follow similar patterns. Investors should always consider various factors and research before making investment decisions.

He is an expert in financial niche, long-term trading, and weekly technical levels.
The primary field of Igor's research is the application of machine learning in algorithmic trading.
Education: Computer Engineering and Ph.D. in machine learning.
Igor regularly publishes trading-related videos on the Fxigor Youtube channel.
To contact Igor write on:
igor@forex.in.rs
Related posts:
- Tesla Stock Price Prediction 2040!
- Amazon Stock Price Prediction 2025!
- Amazon Stock Price Prediction 2050!
- Amazon Stock Price Prediction 2030!
- Why Do Stock Buybacks Increase Share Price?
- Do Stock Splits Increase Share Price?
- Is ETC a Good Investment? – Ethereum Price Prediction 2040
- Tesla vs. Amazon Stock
- Amazon Restricted Stock Units
- What is Share Price? – Share Price Definition!
- Apple Stock Forecast 2024.
- USTEC Nasdaq 100 Stock Index – Chart and Analysis
