Indices trading is popular primarily because it offers exposure to a broad segment of the financial market through a single investment, allowing traders to speculate on the overall performance of an entire market sector rather than individual stocks. This diversification reduces the risk of investing in single stocks and simplifies portfolio management.
Please watch my video about this topic:


Indices like the S&P 500 or the Dow Jones Industrial Average (DJIA) are constructed to represent the performance of a selected stock market segment. The S&P 500, for example, includes 500 of the largest companies listed on U.S. stock exchanges, selected based on market capitalization, liquidity, and industry representation. Its composition is determined by a committee that regularly reviews and adjusts the list of included companies to ensure it accurately reflects the broader market.


The DJIA, on the other hand, consists of 30 significant stocks selected to represent the industrial sector of the American economy. Unlike the S&P 500, the DJIA is a price-weighted index, meaning companies with higher stock prices significantly impact the index’s performance. These indices are continuously updated during trading hours, reflecting the market’s movements and sentiment.
How To Trade Volatility Indices?
To trade volatile indices, you need to monitor the highest high and lowest low of the stock market open because if the price breaks these levels, you can usually follow the primary intraday trend. Additionally, traders must monitor fundamental news like interest rates, investor sentiment, payroll reports, and central bank announcements.
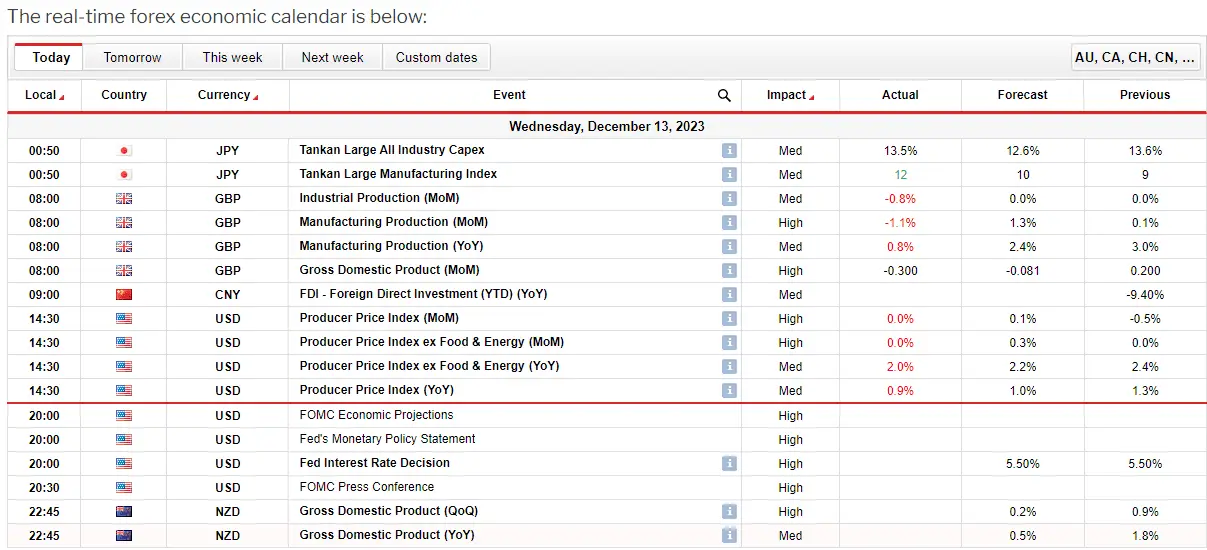
Let us see an example from today, December 13, when the Interest rate decision news will be:
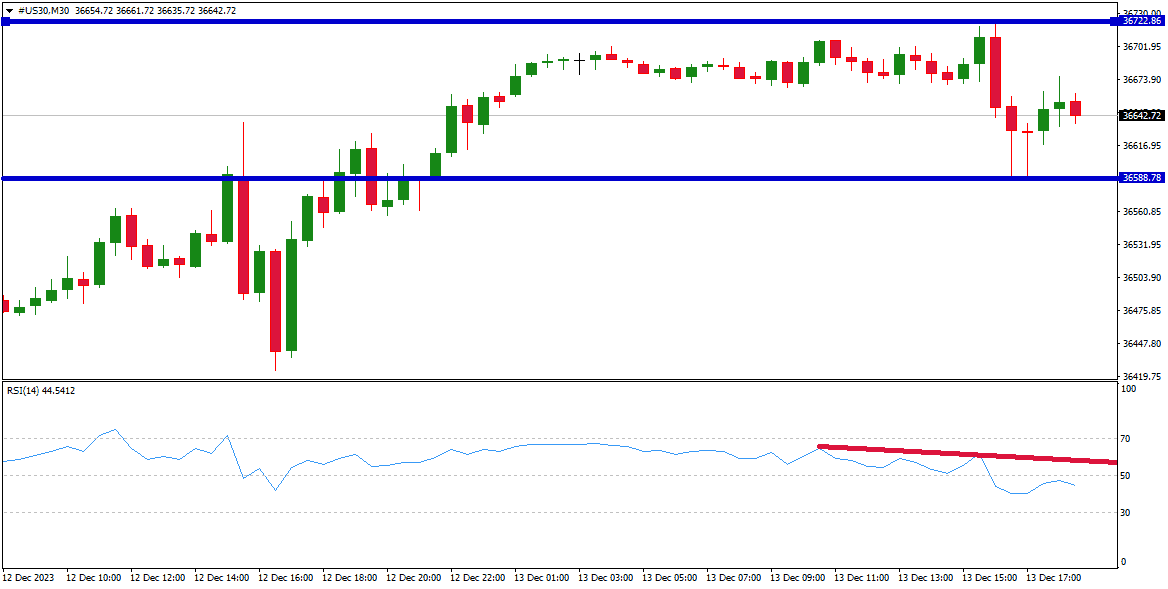

For example, today, I am bearish on the US indexes market because I see a bearish bias on the RSI indicator on the 30-minute chart. Of course, I expect FOMC to keep interest rates.
Trading volatile indices effectively requires a comprehensive strategy encompassing both technical analysis and an awareness of fundamental news. A crucial aspect of the technical approach is monitoring the highest high and the lowest low of a stock market’s opening period. This method is based on the idea that these levels act as crucial support and resistance points. If the price of an index breaks above the highest high, it often indicates a potential uptrend for the day, and traders may choose to follow this momentum. Conversely, if the price falls below the lowest low, it suggests a downtrend, and traders might consider short positions or selling.
However, technical analysis is just one part of the equation. Fundamental news plays a critical role in influencing market sentiment and, consequently, the movement of indices. Interest rate decisions, for example, can significantly impact investor confidence and the attractiveness of stocks. An increase in interest rates often leads to a decline in stock prices as borrowing costs rise and the relative appeal of bonds increases. Conversely, decreasing interest rates can boost stock markets as investors seek higher returns than fixed-income assets.
Investor sentiment, another critical factor, is shaped by various elements, including economic forecasts, political events, and market speculation. Sentiment can swiftly change the market’s direction, making it a vital aspect for traders to monitor. Payroll reports, such as the U.S. Non-Farm Payrolls, offer insights into the employment situation, a significant indicator of economic health and consumer spending capability.
Central bank announcements are also pivotal. Central banks like the Federal Reserve in the U.S. or the European Central Bank in the EU profoundly impact financial markets through monetary policies. Announcements regarding quantitative easing, monetary tightening, or changes in the outlook for the economy can cause significant volatility in indices.
Therefore, to trade volatile indices successfully, a trader must combine the insights gained from the technical analysis of market opening highs and lows with a keen understanding and monitoring of fundamental news. This comprehensive approach helps make informed decisions and more accurately anticipate market movements.
Fundamental News and Indices Trading Strategy
The substantial weight of significant technology stocks like Apple, Google (Alphabet), Microsoft, and Tesla in indices such as the S&P 500 reflects the significant impact and value of the technology sector in the modern economy. Due to their high market capitalization, these companies command a large proportion of the index’s total value, leading to their considerable influence on the index’s performance. Market capitalization is a critical factor in determining a company’s weight in the index, and these tech giants, with their massive market caps, naturally have more sway.
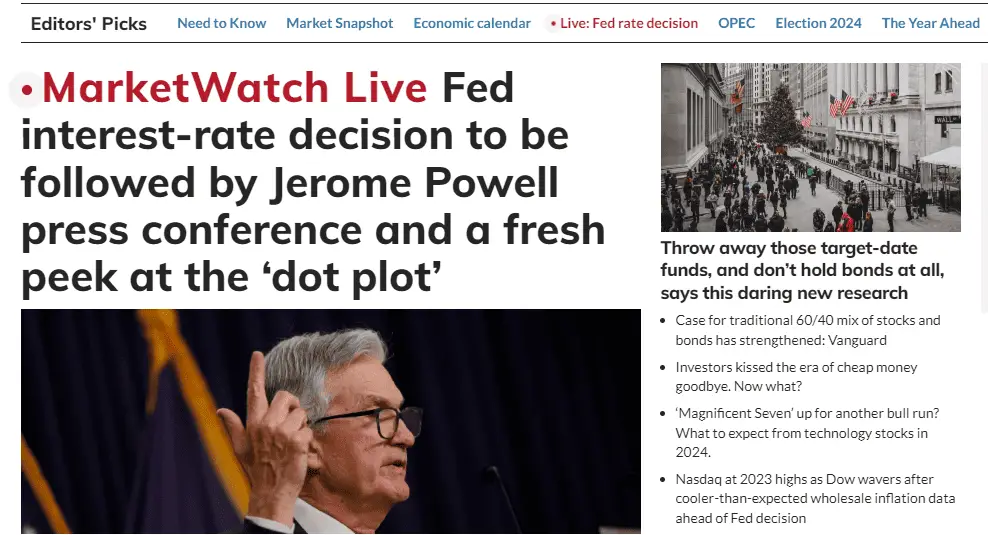
Market Watch website for free stock news monitoring
The dominance of the tech sector, currently comprising around 26.1% of the S&P 500’s weight, indicates the sector’s substantial role in the overall health of the economy. This prominence is due to the tech industry’s rapid growth, innovation, and profitability, which has outpaced many other sectors in recent years. As such, fluctuations in the stock prices of these major tech companies can significantly impact the overall movement of the index.
For investors and analysts, monitoring the tech sector becomes crucial because any significant news or developments within this sector can have a ripple effect across the entire index. This includes product launches, earnings reports, regulatory changes, or broader economic factors affecting technology businesses. For instance, a positive earnings report from a company like Apple or Microsoft can boost investor confidence and drive up the index, while negative news can have the opposite effect.
Therefore, understanding the dynamics and trends within the technology sector is essential for those looking to gauge market movements accurately. It’s not just about tracking the performance of individual companies but also understanding how their combined influence can steer market indices like the S&P 500.

He is an expert in financial niche, long-term trading, and weekly technical levels.
The primary field of Igor's research is the application of machine learning in algorithmic trading.
Education: Computer Engineering and Ph.D. in machine learning.
Igor regularly publishes trading-related videos on the Fxigor Youtube channel.
To contact Igor write on:
igor@forex.in.rs
