S&P 500 represents the stock market index that measures the 500 largest public companies’ stock performance in the United States. Started in 1926, the S&P 500 Index was deemed as a composite index.
What Is the Average Annual Return for the S&P 500?
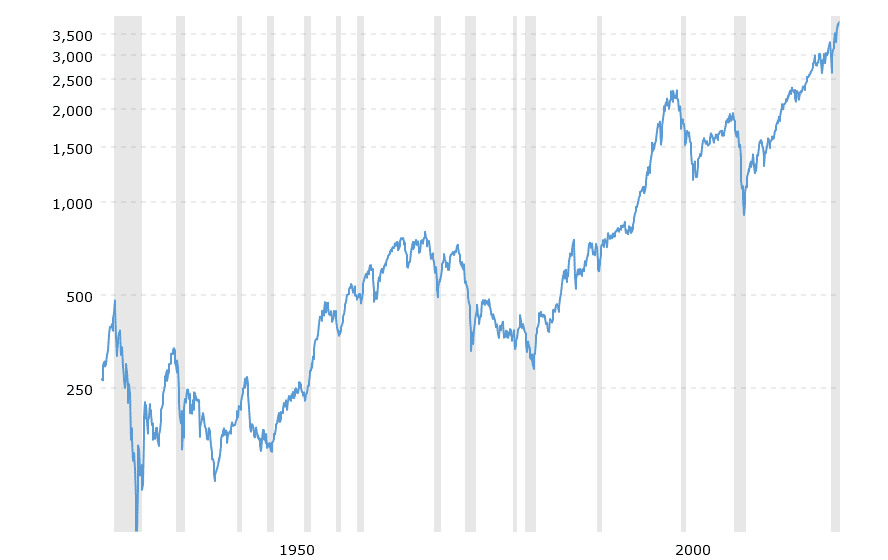
The average stock market return since inception 1926 for S&P 500 index was approximately 12%. In 1957, the S&P adopted 500 stocks, and since then, to 2020, the average annual return for the S&P 500 has been around 11%. Over the last 10 years, from 2011 to 2020, the average annual return for S&P 500 index was 14.5%.


S&p 500 historical performance is presented below:


In Table below is presented S&p 500 historical returns by year:
| Year | Average S&P (%) |
|---|---|
| 2020 | 18.4 |
| 2019 | 31.49 |
| 2018 | -4.38 |
| 2017 | 21.83 |
| 2016 | 11.96 |
| 2015 | 1.38 |
| 2014 | 13.69 |
| 2013 | 32.39 |
| 2012 | 16 |
| 2011 | 2.11 |
| 2010 | 15.06 |
| 2009 | 26.46 |
| 2008 | -37 |
| 2007 | 5.49 |
| 2006 | 15.79 |
| 2005 | 4.91 |
| 2004 | 10.88 |
| 2003 | 28.68 |
| 2002 | -22.1 |
| 2001 | -11.89 |
| 2000 | -9.1 |
| 1999 | 21.04 |
| 1998 | 28.58 |
| 1997 | 33.36 |
| 1996 | 22.96 |
| 1995 | 37.58 |
| 1994 | 1.32 |
| 1993 | 10.08 |
| 1992 | 7.62 |
| 1991 | 30.47 |
| 1990 | -3.1 |
| 1989 | 31.69 |
| 1988 | 16.61 |
| 1987 | 5.25 |
| 1986 | 18.67 |
| 1985 | 31.73 |
| 1984 | 6.27 |
| 1983 | 22.56 |
| 1982 | 21.55 |
| 1981 | -4.91 |
| 1980 | 32.42 |
| 1979 | 18.44 |
| 1978 | 6.56 |
| 1977 | -7.18 |
| 1976 | 23.84 |
| 1975 | 37.2 |
| 1974 | -26.47 |
| 1973 | -14.66 |
| 1972 | 18.98 |
| 1971 | 14.31 |
| 1970 | 4.01 |
| 1969 | -8.5 |
| 1968 | 11.06 |
| 1967 | 23.98 |
| 1966 | -10.06 |
| 1965 | 12.45 |
| 1964 | 16.48 |
| 1963 | 22.8 |
| 1962 | -8.73 |
| 1961 | 26.89 |
| 1960 | 0.47 |
| 1959 | 11.96 |
| 1958 | 43.36 |
| 1957 | -10.78 |
| 1956 | 6.56 |
| 1955 | 31.56 |
| 1954 | 52.62 |
| 1953 | -0.99 |
| 1952 | 18.37 |
| 1951 | 24.02 |
| 1950 | 31.71 |
| 1949 | 18.79 |
| 1948 | 5.5 |
| 1947 | 5.71 |
| 1946 | -8.07 |
| 1945 | 36.44 |
| 1944 | 19.75 |
| 1943 | 25.9 |
| 1942 | 20.34 |
| 1941 | -11.59 |
| 1940 | -9.78 |
| 1939 | -0.41 |
| 1938 | 31.12 |
| 1937 | -35.03 |
| 1936 | 33.92 |
| 1935 | 47.67 |
| 1934 | -1.44 |
| 1933 | 53.99 |
| 1932 | -8.19 |
| 1931 | -43.34 |
| 1930 | -24.9 |
| 1929 | -8.42 |
| 1928 | 43.61 |
| 1927 | 37.49 |
| 1926 | 11.62 |
What is the average daily return s&p 500?
The average daily return for s&p 500 from 1926 to 2020 was -0.015%. For this calculation adjusted close price was used.

Effects of Inflation on S&P 500 Returns
If there is one thing that can give an investor sleepless nights when it comes to S&P 500 is inflation. Inflation-adjusted return S&P 500 shows that the actual return that the investors have received is not 10% but only 7%. In addition to that, we are not even sure about the accuracy of this inflation-adjusted average. This is because this adjustment is made using the figures received from Consumer Price Index. Many believe that the CPI analysis vastly understates the actual rate of inflation. They believe that the return that investors receive is lower than 7%.
The Effects of Market Timing on S&P 500 Returns
The S&P 500 index is considered the benchmark for the overall performance of the American stock market. S&P provides steady returns to stockholders, but entering the market has a huge impact on your returns. For instance, the SPDR® S&P 500® ETF gave promising returns to the investors who entered the market between 1996 and 2000. The same cannot be said for those who bought the stocks between 2000 and 2002 as there has been a consistent downward trend after 2000.
An investor’s strategy also affects their earnings significantly. If you decide to buy when the market is low and hold your investments, you can hope for larger returns. The same is applicable when you sell at market highs. On the contrary, if you are buying during the highs and selling during the market low, you will not benefit.
If you are a beginner, timing the market will not be the best idea for you even though we have seen that time plays a crucial role in investment return. You can consider dollar-cost averaging if you do not want to miss an opportunity.
S&P 500 Index Fund Performance History
The S&P 500 index shows us the overall performance of the entire stock market. It reflects upon the return characteristics of over 500 stocks and the American stock market at large. The stocks that become a part of the S&P 500 index are chosen on various parameters, like liquidity, industry type, and market capitalization. After careful consideration, the companies that can become a part of this index are handpicked by the S&P 500 Index Committee. This committee comprises a group of analysts selected by Standard & Poors.
The index mirrors the performance of some large-cap stocks. Many analysts believe that the S&P 500 and its performance can conclusively show the US economy and stock market’s health. It is seen by many as an economic indicator. Previously, the 30 stocks that were part of the Dow Jones Industrial Average were reckoned as the US benchmark indicator of equities. The S&P 500 index is a larger and more inclusive index than the Dow Jones and has replaced its predecessor over time.
To invest in the S&P 500, you need to buy 500 individual stocks. This is not a possibility for a large number of traders and investors. The way around it is using the performance of the S&P index while investing in a related exchange-traded fund such as SPDR® S&P 500® ETF. ETFs are perfect for beginners and for those who are not looking forward to taking big risks. Through ETFs, you get the opportunity to diversify your portfolio without risking a lot.
Need for a Stockbroker
Any investing requires a stockbroker who varies a lot from each other based on the features offered on their platform, intent, prices, and overall performance. Before you select a broker, it is also important to check whether those brokers are more suited to the styles of a beginner or an experienced trader and investor.
Conclusion
The overall average growth of the S&P 500 has made it a popular choice amongst investors. Even if you are not investing in it directly, you can invest in related ETFs. The performance of this index has also become an economic indicator. Therefore, you can use its data in more ways than one.

He is an expert in financial niche, long-term trading, and weekly technical levels.
The primary field of Igor's research is the application of machine learning in algorithmic trading.
Education: Computer Engineering and Ph.D. in machine learning.
Igor regularly publishes trading-related videos on the Fxigor Youtube channel.
To contact Igor write on:
igor@forex.in.rs
