The color RSI with an alert indicator for MT4 enhances the traditional RSI by incorporating price alerts, BUY and SELL arrow signals on charts, and color changes for overbought and oversold conditions, aiding forex traders in making informed decisions. Suitable for both novices and experienced traders, this versatile indicator can be applied to various timeframes, from intraday to monthly, and is available for free download and easy installation.


Please you can free download this indicator below:
RSI Color Indicator MT4 Download


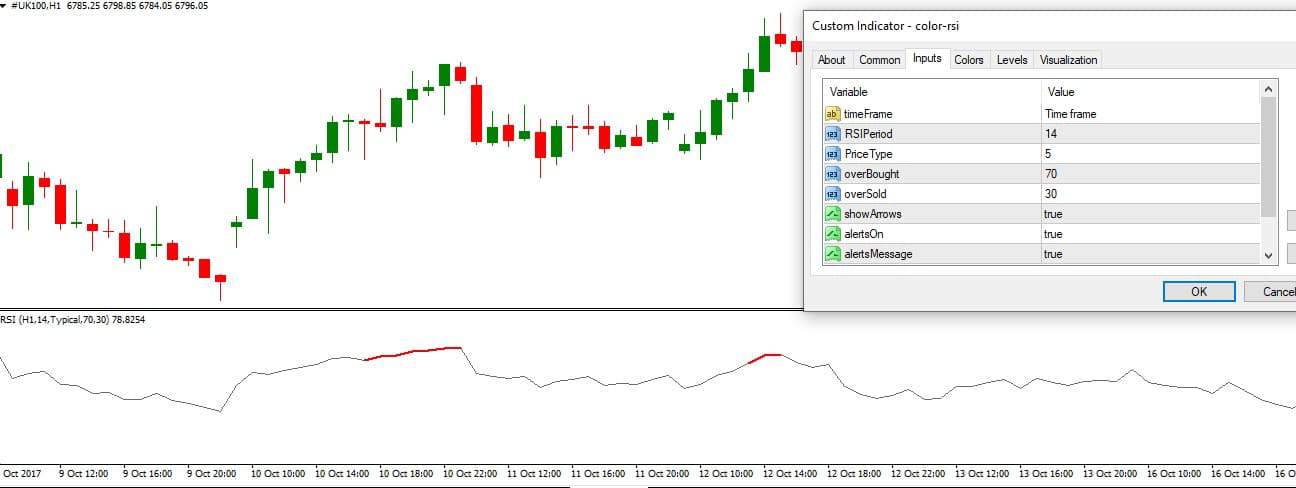
RSI color indicator is an MT4 indicator that draws a color oscillator when the price goes to the RSI level. For example, we will see the red line if the price exceeds the 70 RSI level.
The “color RSI with alert indicator for MT4” is an enhanced version of the standard RSI (Relative Strength Index) used in forex trading, specifically designed for the MetaTrader 4 platform.

Here’s how it works in detail:
- Basics of RSI: The Relative Strength Index (RSI) is a momentum oscillator that measures the speed and change of price movements. RSI oscillates between 0 and 100 and is typically used to identify overbought or oversold conditions in a traded security. A reading above 70 is typically considered overbought, while a reading below 30 indicates an oversold condition.
- Customizable Thresholds: While the default settings for the overbought and oversold levels are 70 and 30, respectively, the color RSI indicator allows traders to customize these thresholds in the settings. This means that if a trader believes that for a particular market or under certain conditions, an RSI of 65, for example, indicates an overbought condition, they can adjust this value in the settings.
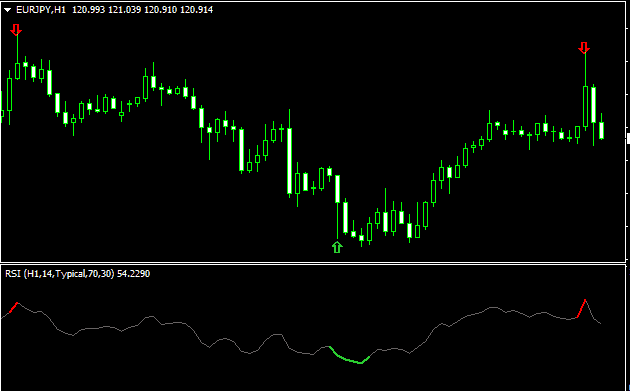
- Visual Enhancements: Unlike the traditional RSI, which is typically displayed in one color, the color RSI indicator changes colors based on market conditions. When the RSI reaches the overbought threshold, the indicator will color the RSI chart in red. Conversely, when the RSI dips to the oversold threshold, the indicator will color the RSI chart in green.
- Arrow Signals: The indicator provides visual arrow cues on the main trading chart and color changes. When the market condition switches to overbought, a sell arrow will appear, indicating that it might be an opportune moment to sell or go short. Similarly, a buy arrow will be displayed when the market is deemed oversold, suggesting a potential buying or going long opportunity.
- Alerts: The color RSI with alert indicator also incorporates alerts to ensure that traders don’t miss potential trading opportunities. When the RSI reaches the set overbought or oversold levels, the system can notify traders with an alert, prompting them to check their charts and make informed decisions.
In summary, the “color RSI with an alert indicator for MT4” takes the foundation of the traditional RSI and enhances it with visual cues and alerts, making it more user-friendly and actionable for traders on the MetaTrader 4 platform. By providing a more vivid representation of market conditions and potential trading signals, this indicator aids traders in making timely and informed decisions.

He is an expert in financial niche, long-term trading, and weekly technical levels.
The primary field of Igor's research is the application of machine learning in algorithmic trading.
Education: Computer Engineering and Ph.D. in machine learning.
Igor regularly publishes trading-related videos on the Fxigor Youtube channel.
To contact Igor write on:
igor@forex.in.rs
