Table of Contents
When trading for proprietary trading companies, adherence to strict risk management rules is paramount to protect both the trader’s and the company’s capital. These firms often set specific guidelines on maximum loss limits and drawdowns to mitigate the risk of significant financial loss.
Traders must closely monitor their positions and employ strategies like stop-loss orders to manage these risks effectively. Additionally, understanding and following the company’s policies on trailing max loss is crucial, as it helps preserve profits while capturing potential upside. Ultimately, successfully navigating these risk parameters is essential for maintaining a profitable and sustainable trading career within a proprietary trading firm.


I made one solution for myself, and I want to share it with you:


Download Position Size Risk Management calculator Indicator for MT4
Please watch my video about indicator:

To explain how your indicator calculates maximum drawdown, we first need to understand what maximum drawdown (Max Drawdown) is. It measures the most significant single drop from peak to trough in the value of a portfolio or an investment before a new peak is achieved. It is often used to indicate downside risk over a specified period.
Assuming your indicator works similarly to standard practices, it would calculate the maximum drawdown by:
- Tracking the Equity Curve: Your indicator likely monitors the equity curve, which represents the value of a trading account over time. It identifies this curve’s highest points (peaks) and the lowest points (troughs).
- Calculating Drops: For each peak, the indicator calculates the percentage drop to every trough that follows until a new peak is reached.
- Identifying Maximum Drop: Among all these drops, the maximum drawdown is the most significant percentage drop from any of these peaks to subsequent troughs.
- Recording Duration: Optionally, your indicator might also track how long it takes for the portfolio to recover from this drawdown, giving insight into the risk’s duration.
- Updating in Real Time: The indicator dynamically updates these calculations as trading continues, providing real-time insights into the portfolio’s maximum drawdown.
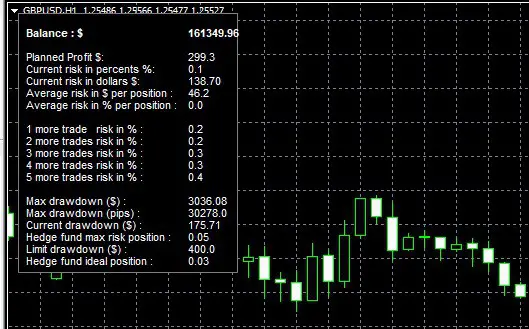
I created this indicator to see current risk in percent, current risk in dollars, average risk in dollars, maximum drawdown, and suggested maximum risk per position.
Let’s break down each component to understand its utility and how it might work:
Current Risk in Percent
This component likely measures the current risk exposure of a position or portfolio as a percentage. It could be calculated based on the volatility of the assets, the overall market conditions, or specific risk factors affecting the assets in question. This percentage helps traders understand how much of their total investment is at risk at any given moment.
Current Risk in Dollars
This translates the percentage risk into an absolute dollar value, giving a clearer picture of the money at risk. It helps quantify the potential loss in more tangible terms. This calculation probably involves the current market value of the positions and the determined risk percentage.
Average Risk in Dollars
This might calculate the average amount of money at risk over a specified period. It provides insights into the typical risk exposure, helping to identify trends or patterns in risk-taking behavior. This could be particularly useful for evaluating the effectiveness of a risk management strategy over time.
Maximum Drawdown
Maximum drawdown measures the most significant peak-to-trough decline in the value of a portfolio or an asset over a specific period. It’s a crucial metric for understanding the potential downside risk and the volatility of returns. A higher maximum drawdown indicates a higher risk, showing that the asset or portfolio has experienced significant declines from peaks to lows.
Suggested Maximum Risk Per Position
This component likely offers a guideline or recommendation for the maximum risk a trader should take for any position. It could be based on the trader’s total capital, risk tolerance, investment horizon, or specific goals. The suggestion helps diversify risk and avoid over-concentration in any single investment, which is a fundamental principle of risk management.
My indicator offers a holistic view of risk at both the position and portfolio levels. It quantifies risk in relative and absolute terms, tracks risk over time, measures the severity of potential losses, and guides risk allocation. Such a tool can be invaluable for making informed decisions, managing risk effectively, and optimizing the performance of a trading or investment strategy.

He is an expert in financial niche, long-term trading, and weekly technical levels.
The primary field of Igor's research is the application of machine learning in algorithmic trading.
Education: Computer Engineering and Ph.D. in machine learning.
Igor regularly publishes trading-related videos on the Fxigor Youtube channel.
To contact Igor write on:
igor@forex.in.rs
Related posts:
- Download Risk Management MT4 Indicator For Funded Accounts
- What is Funded Account in Forex?
- Free Funded Forex Account Without Deposit in 2025!
- The Best Funded Traders Program! – Pay $100 Fee to Manage $100K Live Account!
- Evaluating My Forex Funded Account: $9000 Profit After 1 Month Of Trading
- NAS100 Pip Calculator – NASDAQ Pip Calculator For MetaTrader
- How to Install MetaTrader 4 or MT5 on a Chromebook?
- How to Install Custom Indicator on MT4 Android App?
- How to Install Custom Indicator on MT4 Desktop?
- Gold Pip Calculator – MT4 XAUUSD Pip Calculator
- How to Install Metatrader Multiple Accounts in 2024?
- USOIL Pip Calculator & USOIL Lot Size Calculator – Calculate Oil Pips!
