Novice and seasoned traders constantly seek tools and techniques to interpret these movements and predict future price action. One of the most revered tools in a trader’s arsenal is the use of Forex trading patterns. These patterns, formed by the price movements of currency pairs over specific periods, provide valuable insights into potential upcoming price shifts.
By analyzing historical data and monitoring current price movements, traders become proficient in spotting repeating patterns. Once a pattern is identified, it can signal whether to buy or sell a currency pair, helping traders to time their entry positions optimally. While no strategy guarantees success, the consistent application of pattern recognition significantly increases the odds of making profitable trades.
What is the Tweezer Bottom pattern?
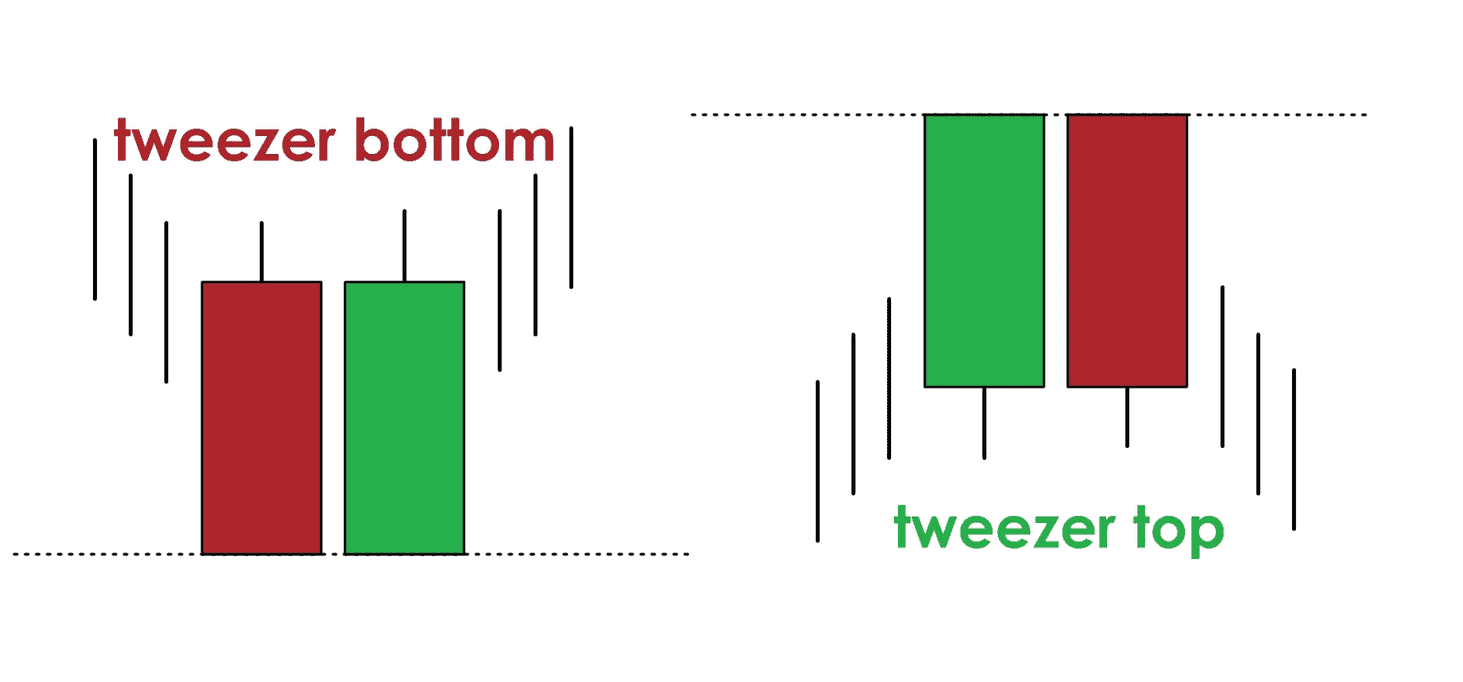
The Tweezer Bottom is a bullish reversal candlestick pattern that can appear after a prolonged downtrend. The first candle is bearish, and the second is bullish, while both candlesticks in the pattern have roughly equal-length lower shadows (or wicks). The pattern indicates that the price has tested a particular support level but rebounded on both occasions.


Traders use it to identify potential upward price movements and possibly signal the end of a bearish trend. Here’s a detailed breakdown:
Tweezer Bottom Pattern Characteristics:
- Formation: The Tweezer Bottom pattern consists of two candlesticks:
- The first is a bearish candle (typically a long red/black candle) that continues the prevailing downtrend.
- The second is a bullish candle (typically a long green/white candle) that signals a potential reversal.
- Shadow Length: Both candlesticks in the pattern have roughly equal-length lower shadows (or wicks), which indicates that the price has tested a particular support level but has rebounded from it on both occasions. The lengths of these shadows are a crucial feature of the Tweezer Bottom, giving the pattern its name due to the resemblance to a pair of tweezers.
- Closing Levels: While the lower shadows (wicks) are of similar lengths, the closing levels of the two candles can differ.
- Confirmation: For increased reliability, traders often wait for a third candle that closes higher than the second candle’s close as a confirmation of the reversal.
How to Trade Tweezer Bottom?
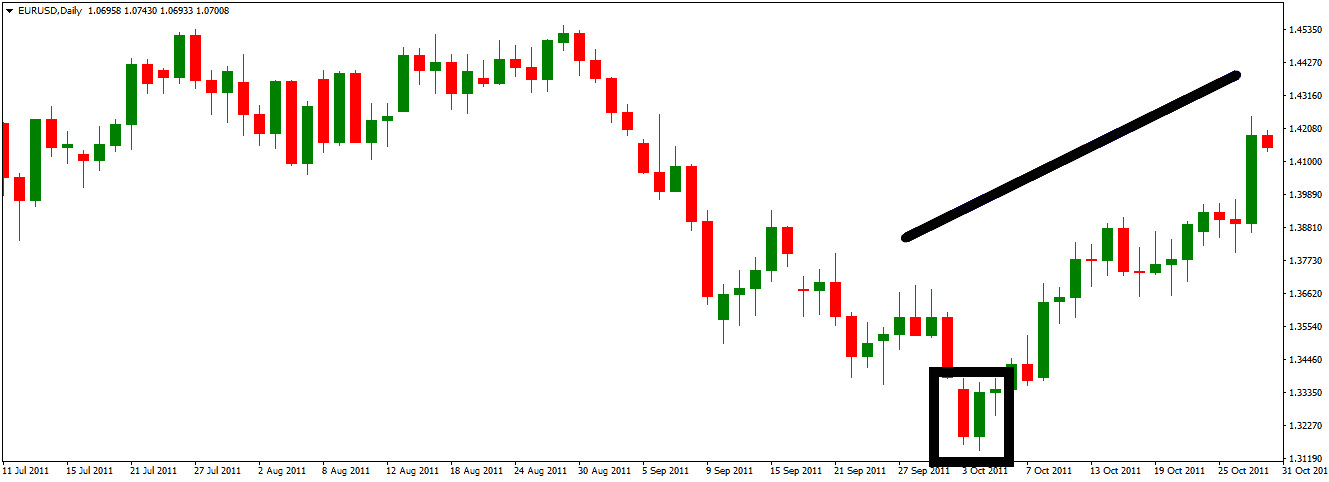
To trade the tweezer bottom pattern, you can make a buy order after the bullish candle and set a stop loss just below the last candle low. The first candle in the tweezer bottom is bearish, and the second is bullish, while both candlesticks in the pattern have roughly equal-length lower shadows (or wicks).
Below is the EURUSD daily chart with one real live trading example:

Trading the Tweezer Bottom Pattern:
- Entry Point: Once a trader identifies the Tweezer Bottom, they may consider entering a long position (buying) after forming the second candle, especially if there’s a confirmation candle afterward.
- Stop Loss: A common strategy is to set a stop loss just below the low of the Tweezer Bottom pattern. This ensures that potential losses are minimized if the price continues to fall.
- Target Price: Traders can set target prices based on previous resistance levels or by assessing the potential strength of the reversal.
From my trading journey, I’ve had the chance to analyze, test, and execute various technical patterns. The Tweezer pattern, often lauded for its predictive capabilities, has been a consistent part of this repertoire. However, the reality on the ground, based on my experience, doesn’t always align with popular sentiment.
In practical terms, I’ve found the Tweezer pattern to exhibit a success rate between 50% and 53%. In essence, for every ten trades I make relying solely on this pattern, only 5 to 6 of them, on average, result in a successful outcome. While slightly better than a coin flip, this success rate certainly doesn’t position the Tweezer as a dominant or exceptionally reliable pattern in isolation.
When I equate my risk-reward ratio to a 1:1 metric, meaning that for every $1 I risk, my profit target is also $1, and the returns based on the success above rate become marginal. This implies that the gains from successful trades only offset the losses from unsuccessful ones, leaving a minuscule net profit.
This doesn’t entirely dismiss the Tweezer pattern; its occurrence can provide valuable insights into potential market reversals. However, the overarching lesson from my trading journey is clear: Relying solely on the Tweezer pattern without incorporating other indicators or a more holistic trading strategy could lead to inconsistent results and limited profitability.
In conclusion, while the Tweezer pattern offers valuable insights, it’s crucial, based on personal experience, to approach it with caution and to always consider it as a single tool among many in a diverse trading toolbox.

He is an expert in financial niche, long-term trading, and weekly technical levels.
The primary field of Igor's research is the application of machine learning in algorithmic trading.
Education: Computer Engineering and Ph.D. in machine learning.
Igor regularly publishes trading-related videos on the Fxigor Youtube channel.
To contact Igor write on:
igor@forex.in.rs
