Order flow in trading refers to analyzing the volume and type of orders being executed in the market to make trading decisions. This concept is particularly prevalent in day trading and short-term trading strategies. The basic idea behind order flow analysis is that by understanding the orders entering the market, a trader can get a clearer picture of supply and demand at a given time and make better trading decisions.
How to See Order Flow in Forex?
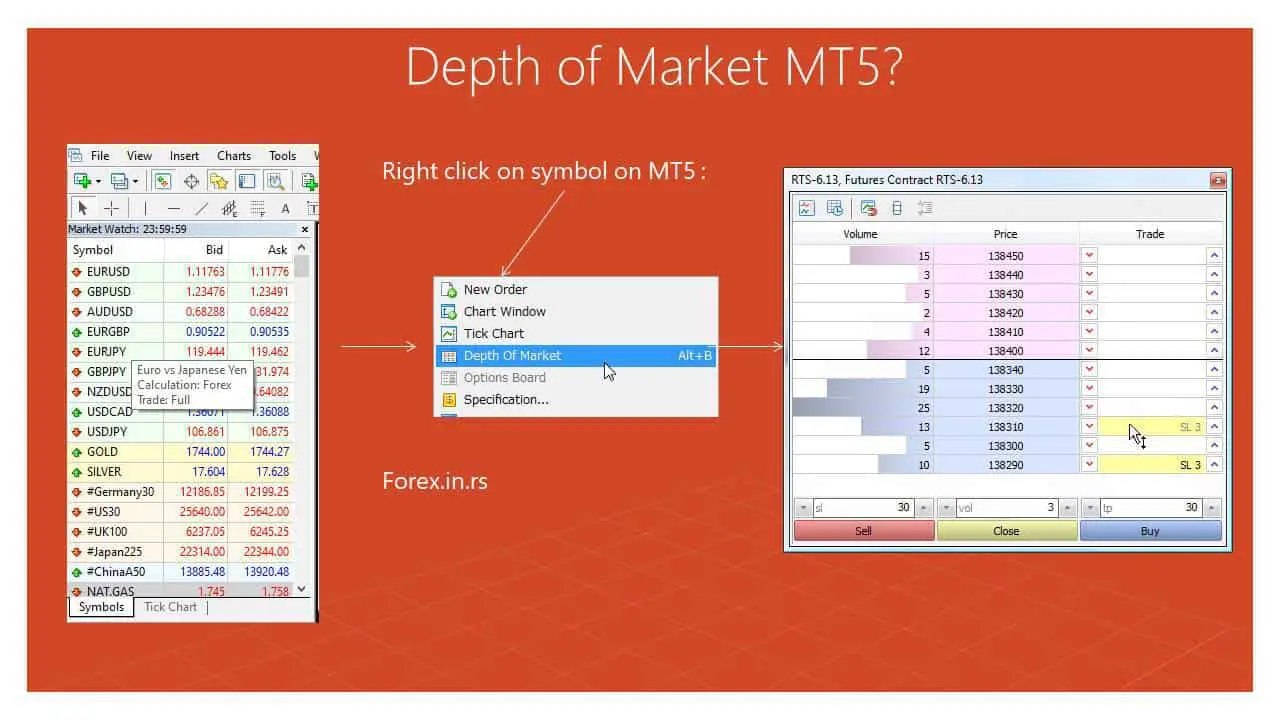
Check the DOM (Depth of Market) chart to see the order flow in the Forex. In the MT5 platform, go to View and choose the “Depth of Market” option. However, in MT4, you need to use a custom order flow indicator. A DOM (Depth of Market) chart visually represents bid and ask prices, along with the volume of orders at each price level in the market.
Order flow analysis interprets the market’s balance of buy and sell forces to predict potential price turning points. While a rising price indicates more buyers than sellers, this momentum eventually shifts when sellers overtake, leading to price reversals. Utilizing order flow, traders can identify future price levels where order imbalances may occur, allowing for precise entry and exit strategies.


Please see my video:


Now, I will share my opinion on Why I Believe You Shouldn’t Rely on Order Fow in Forex:
Forex order flow differs from equities order flow based on level 2 market data. Instead, forex brokers offer volume indicators that only reflect tick counts, not actual order sizes. This inherent difference means forex traders often turn to chart patterns and other tools to infer potential order imbalances rather than directly observing them as stock traders can.

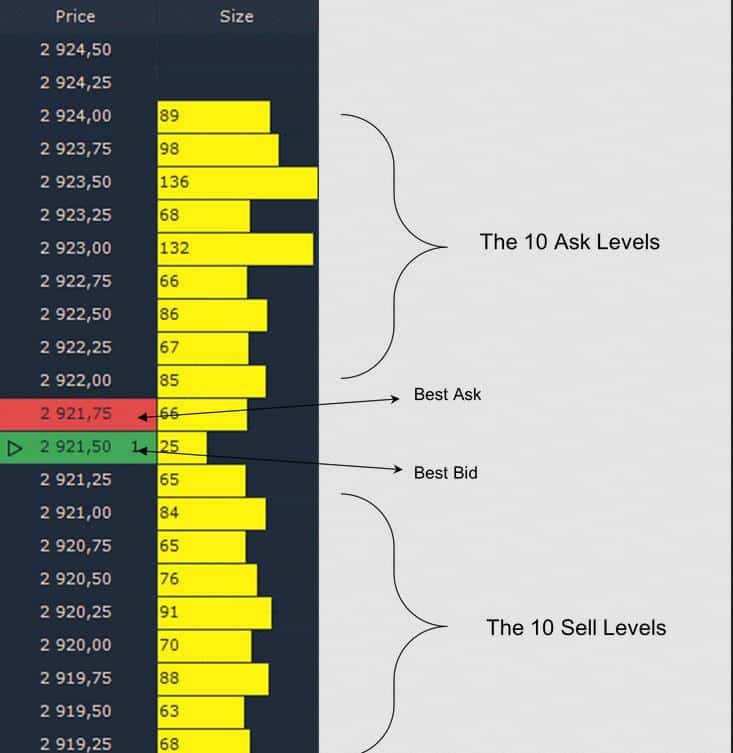
The Depth of Market (DOM) in MetaTrader 5 (MT5) is an interface tool that displays the depth and liquidity of a financial instrument at different price levels in real time. It’s beneficial for traders to understand the supply (sell orders) and demand (buy orders) at various price tiers. Here’s an in-depth look at DOM in MT5:
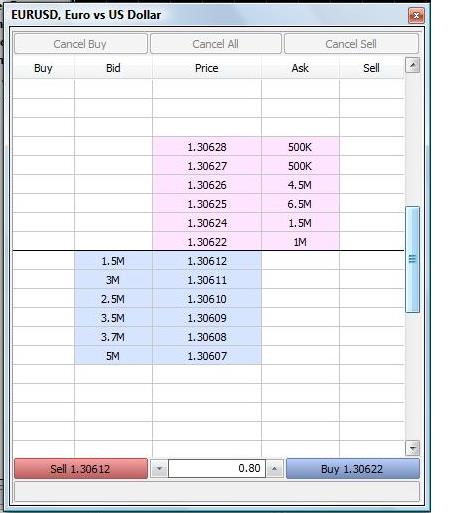
- Bid and Ask Columns: The DOM in MT5 showcases two primary columns.
- Bid (left column): Displays the prices and quantities at which participants are willing to buy.
- Ask (right column): Represents the prices and quantities where participants are ready to sell.
- Volume: Next to each price on the bid and ask columns, a number shows the quantity (volume) of the instrument available at that specific price.
- Central Price Line: In the middle of the DOM, usually distinguished, is the current market price or the last traded price.
In MT5, the Depth of Market (DOM) can be accessed by right-clicking on the market watch window, providing a real-time view of liquidity at different price levels and allowing traders to assess market direction swiftly. The platform’s one-click trading feature within the DOM facilitates immediate order execution, capitalizing on transient trading opportunities.
Using the Depth of Market (DOM) in MT5 provides traders with real-time insights into a particular instrument’s liquidity and order flow. Here’s how one might use the information from the DOM for trading, taking EUR/USD as an example:
- Observing Liquidity:
- Scenario: In the DOM for EUR/USD, you notice a significant number of buy orders (bids) at the 1.1000 level, with a much higher volume than the above and below.
- Interpretation: This could indicate a strong demand at the 1.1000 level, making it a potential support zone.
- Action: If the price is currently above this level and you’re considering a long position, this could offer a reasonable area for a stop-loss, as breaking this level might signify a more vital bearish move.
- Assessing Market Direction:
- Scenario: You observe a sudden increase in sell orders (asks) at the 1.1050 level, and the volume starts to outweigh the buy orders substantially.
- Interpretation: This could hint at potential selling pressure or resistance at 1.1050.
- Action: If you’re in an extended position, you might consider taking profits near this level, or if you’re looking for shorting opportunities, this level might interest you.
- Immediate Order Placement:
- Scenario: While watching the DOM, you notice that the sell orders at the 1.1030 level start to decrease rapidly, and buy orders dominate.
- Interpretation: This could suggest a surge in buying interest, and the price might continue to rise.
- Action: Using the one-click trading feature in the DOM, you immediately place a buy order to capitalize on this potential upward move.
- Avoiding Price Slippage:
- Scenario: You want to sell a large quantity of EUR/USD. On inspecting the DOM, you notice that the available volume at the current market price might not be sufficient for your order size.
- Interpretation: Executing a large market order here might result in price slippage.
- Action: Instead of placing a single large market order, you could opt for breaking your order into smaller parts, using limit orders at different price levels, or waiting for more liquidity to come into the market.
See what DOM looks like on different platforms:
How Order Flow is Used in Trading:
- Identifying Supply and Demand: By watching where limit orders are placed, traders can understand where there is buying or selling interest. Areas with large clusters of limit orders can be potential support or resistance levels.
- Market Momentum: A surge in market orders in a particular direction can indicate strong momentum. For instance, a sudden influx of market buy orders might suggest a strong buying interest, and the price could continue to rise.
- Stop Hunts: This refers to a situation where prominent players intentionally push the price towards levels where they believe many stop orders are placed, triggering those stops and benefiting from the subsequent price movement.
- Liquidity Pools: These areas have a concentration of limit orders. Due to the size of their orders, big players often require these liquidity pools to enter or exit the market without causing significant price slippage.
Conclusion
In the forex market, order flow analysis isn’t as straightforward as in stock markets due to its decentralized nature. While stock markets provide detailed level-two data feeds through centralized exchanges, showcasing pending orders and their quantities, the forex market lacks a universal source for such data. Instead, forex brokers offer volume indicators that only reflect tick counts, not actual order sizes. This inherent difference means forex traders often turn to chart patterns and other tools to infer potential order imbalances rather than directly observing them as stock traders can. Thus, while order flow is a powerful concept, its application in forex requires a distinct approach compared to stocks.

He is an expert in financial niche, long-term trading, and weekly technical levels.
The primary field of Igor's research is the application of machine learning in algorithmic trading.
Education: Computer Engineering and Ph.D. in machine learning.
Igor regularly publishes trading-related videos on the Fxigor Youtube channel.
To contact Igor write on:
igor@forex.in.rs
Related posts:
- What is Order Block in Forex? – Order Block Trading Strategy
- What is Toxic Order Flow?
- What is Order Level Trading – Various Types Of Trading Order
- What Does the Circular Flow Model Illustrate
- What is The Money Flow Index MFI indicator?
- Download Chaikin Money Flow Indicator for MT4
- MT4 Order Types
- What is Stop Loss Order?
- Stop Limit Order Strategy
- How to Place Same Order in Multiple Trading Accounts?
- How to Set Stop Loss on TD Ameritrade? – Thinkorswim Order Types
- Stop Loss vs. Stop Limit Order
