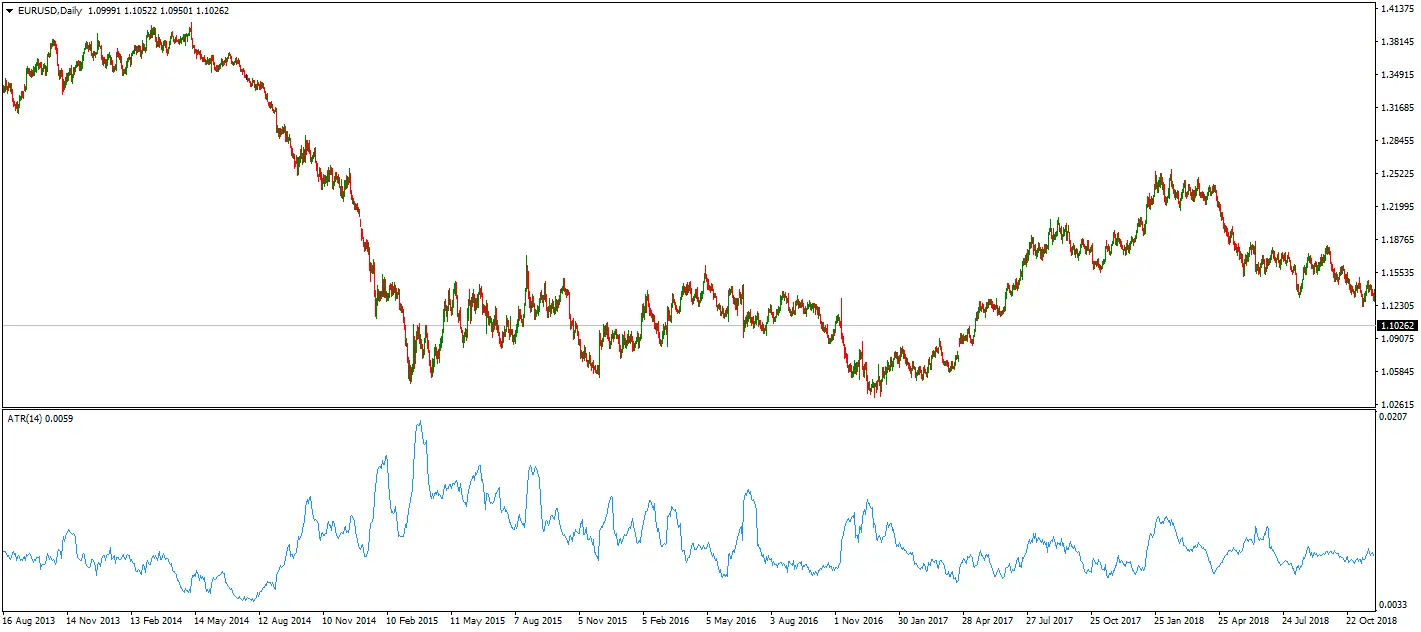
If we detect the highest high price during the day and the lowest low price level, we can get a daily average true range for EURUSD. The actual average range, or ATR, is the average daily movement for any currency pair. Usually, traders use the ATR volatility indicator to analyze daily, weekly, and monthly volatility.
Let’s examine the most recent analysis from 2024 regarding the EURUSD volatility of the previous year.
How many pips does EURUSD move daily in 2023?
The EURUSD average daily pips volatility in 2023. was 87 pips, where the highest daily range was 243 pips (March 15. 2023.), and the lowest daily range was only 28 pips (August). Currently, in the February 2024., EURUSD volatility has decreased.


See my analysis for the year 2022:


If we analyze the EURUSD daily move, we can conclude that during the Euro session and US session overlap (around 16 hours GMT+1), volatility is the highest, and the EURUSD moves the most in the afternoon. Please check volatility in pips per hour for EURUSD:
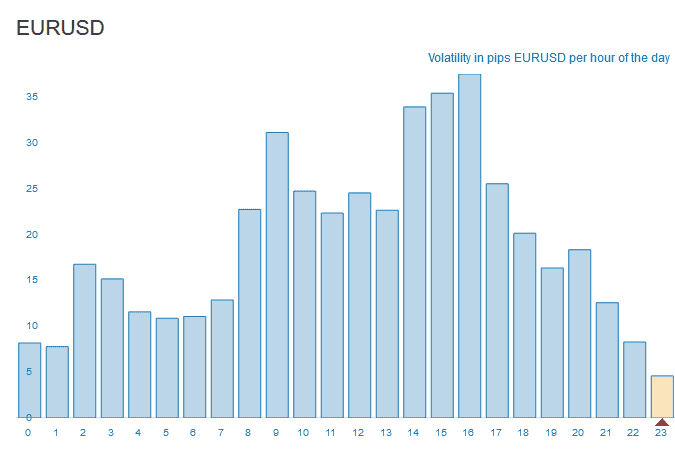
As we can see on the chart above, the highest number of pips (highest volatility) is around 16 hours (16 hours GMT+1) when the US market and EU market overlap in 2023. The highest daily move for EURUSD was around 37 pips on average at 4 pm GMT+1.

Results are similar to the same as for GBPUSD (read our article How Many Pips Does GBPUSD Move Daily in 2022)
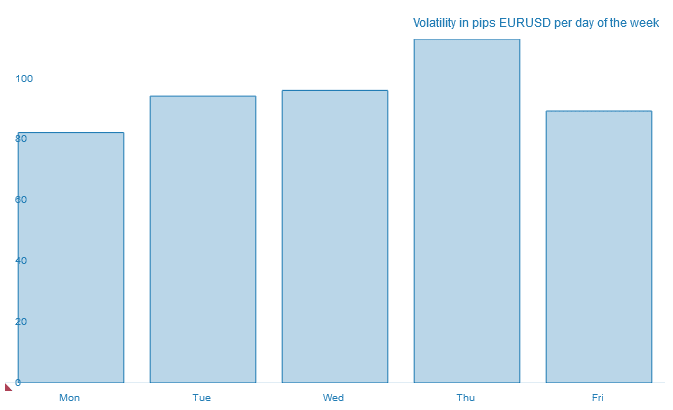
During the week, EURUSD moves the most during Thursday. For example, EURUSD in 2023. has 113 pips volatility on Thursday, while the least volatility was on Mondays, around 82 pips on average (see image below).
Finally, the average EURUSD volatility was 75 pips for several years.
The most exciting year for EURUSD was 2020., the year of the COVID-19 recession and increased volatility.
How many pips did EURUSD move daily in 2020?
The average daily range for EURUSD in 2020. was 74 pips, the highest daily range was 332 pips (March 19. 2020.), and the lowest daily range was only 17. As a result, EURUSD, the most heavily traded currency pair globally, had an average daily movement of 70 pips.
We got all these numbers from the ATR Average True Range indicator.
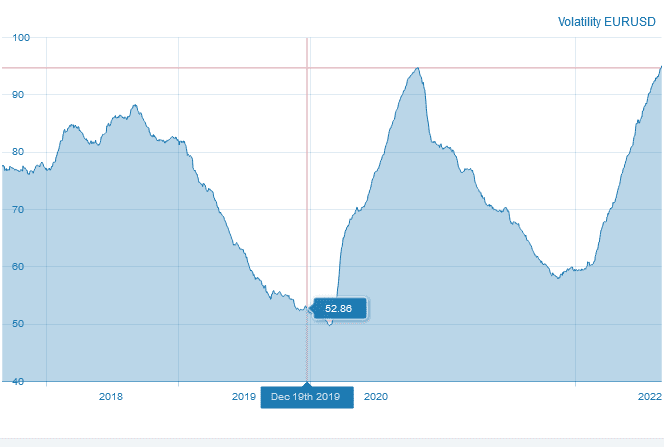
As we can see, in the last five years, EURUSD volatility has been lower and lower each year. The average range is significant because it helps traders stop losses and targets on the right level and better calculate projected profits and losses.
For the previous ten years, most of the time, the daily average had a rate of over seventy pips. But there have also been long periods where the rate was over one hundred pips.
At the commencement of 2019, the EURUSD experienced a drop to a rate of under sixty pips and has predominantly remained at that rate. This has caused the day trading of the EURUSD to become more problematic when such rates are indicated on the EURUSD volatility chart.
This has become more difficult as a result of there being fewer movements to view. Concerning the EURUSD, It is much more challenging to jump into and out of trading efforts while securing a profit when considering the spread and commissions.
This issue has been offset via lower spreads offered by some brokers at a rate of 0.1 pips. As a result, small moves are more accessible to notice. However, you are at a disadvantage when the spread is more significant.
It is essential to consider volatility in day trading, which can significantly impact how traders make their trades and the profits they achieve. Traders with more experience for at least a few years may struggle with the regular decrease in the EURUSD pair’s volatility. Also, those new to the world of trading likely do not realize that the EURUSD has, over its history, been traded under many different results. Traders with more experience for at least a few years may struggle with the regular decrease in the EURUSD pair’s volatility.
With this being the case, it is wise to examine the EUR-USD volatility at this present time. Furthermore, using the presented statistics to help one’s trading efforts is essential.
The volatility of the EURUSD can be seen by the day of the week and the day’s hour. We recently wrote an article about the best trading time for EURUSD in the GMT zone. If so, you can adjust the chart to suit your time zone. See the Figure below:
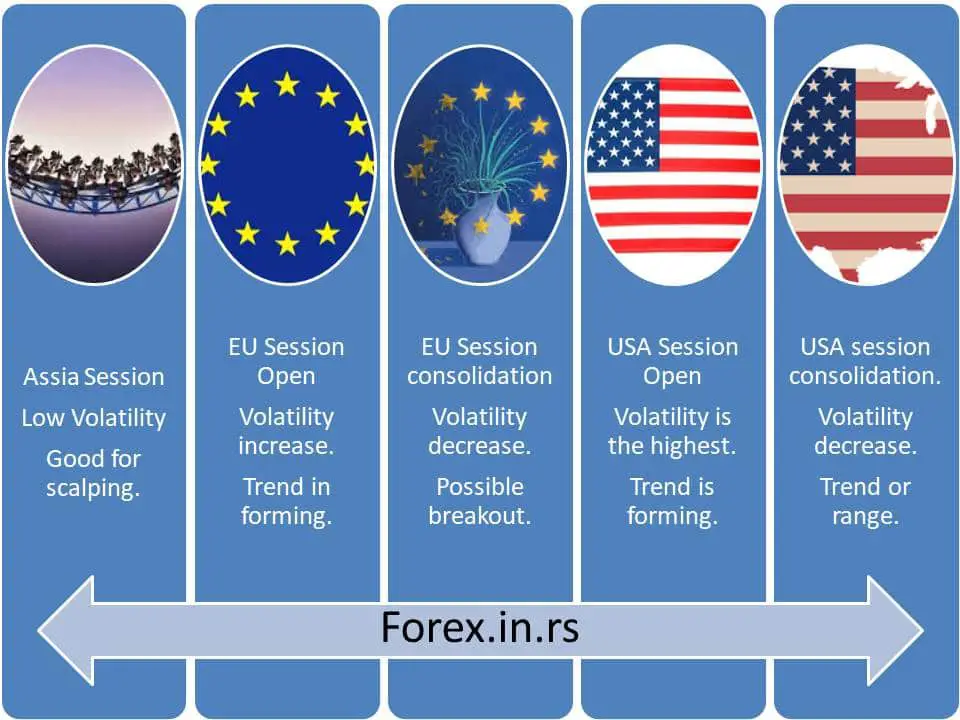
It is common for the hours that possess the predominant movement to range from seven in the morning until four in the afternoon. This is in correlation to the market in London. Then, there may be an uptick in New York’s market movement around one in the afternoon. If this is the case, if your time happens to be after the movement, you should conduct trading from seven in the morning to four in the afternoon according to the time zone presented on the chart to experience the least EURUSD volatility and best profits.
Forex pairs’ daily range
The average daily trading range for currency pairs is 54 in 2021 (major forex pairs). Each forex pair has a different average volatility. Please see the major forex pairs’ daily range below in the Table:
| Major forex pairs | Forex average daily range in pips |
|---|---|
| EUR/CHF | 35 |
| NZD/USD | 39 |
| USD/JPY | 41 |
| EUR/USD | 44 |
| USD/CHF | 44 |
| EUR/GBP | 50 |
| EUR/JPY | 55 |
| USD/CAD | 56 |
| GBP/USD | 82 |
| GBP/JPY | 94 |
| Average pip movement | 54 |

He is an expert in financial niche, long-term trading, and weekly technical levels.
The primary field of Igor's research is the application of machine learning in algorithmic trading.
Education: Computer Engineering and Ph.D. in machine learning.
Igor regularly publishes trading-related videos on the Fxigor Youtube channel.
To contact Igor write on:
igor@forex.in.rs
