TradingView is a renowned platform in financial markets, widely appreciated for its comprehensive suite of tools tailored for traders and investors. One of its standout features is its robust and user-friendly environment for developers, allowing for creating and sharing custom trading indicators and strategies.
Its proprietary Pine Script language, explicitly designed for coding custom indicators, further enhances this flexibility. This language is accessible even to those with limited programming experience. Additionally, TradingView boasts a vast library of free trading indicators contributed by its active community of users, offering a wide range of analytical options for various trading styles and markets.
This combination of developer support and a wealth of free resources makes TradingView an exceptional platform for novice and experienced traders looking to enhance their trading analysis and strategies.


In this article, I will present one exciting indicator.


Please watch my video:
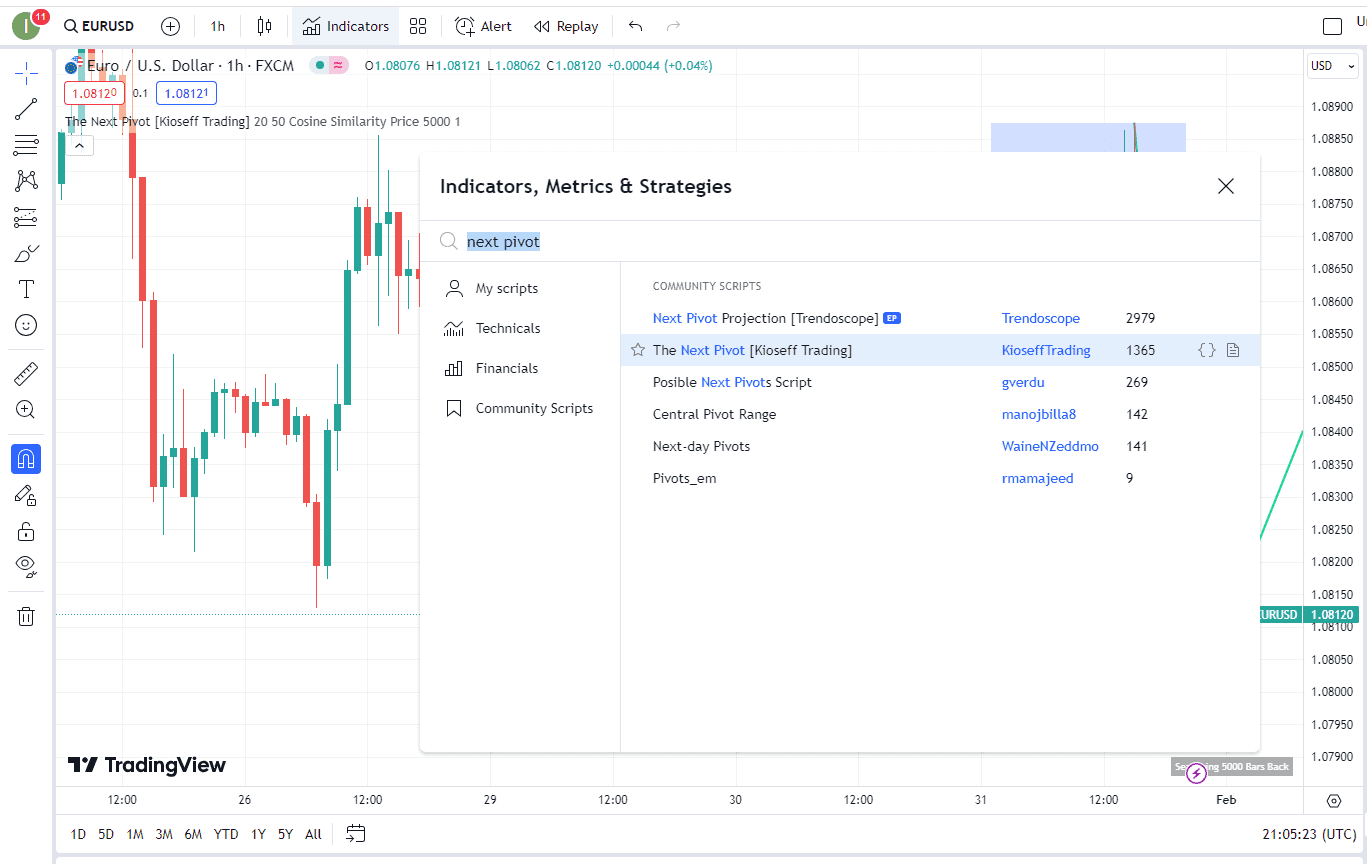
The free Tradingview indicator for price trajectory prediction is called “Next Pivot.” ” You can install an indicator by going to Indicators and typing the indicator name.
TRADINGVIEW PRO AD-FREE CHARTS

Please see the image below:
The TradingView indicator “The Next Pivot” represents an intriguing approach to financial market analysis, blending historical data comparison with predictive modeling. At its core, the tool employs various similarity measures to match the current price sequence with historical sequences. The aim is to find the historical pattern that is most similar to the current situation and then use this to forecast future price movements.
One of the critical functionalities of “The Next Pivot” is its ability to scan and compare price sequences. This comparison isn’t limited to a narrow window; it can extend up to 100 bars from the current bar. Once a matching sequence is identified, the script projects the subsequent price movement forward, potentially offering a glimpse into the future movement of the market for up to 250 bars. This forecast covers the price path and includes elements like a forecasted ZigZag pattern, which can be pretty helpful in identifying potential pivots in the market.
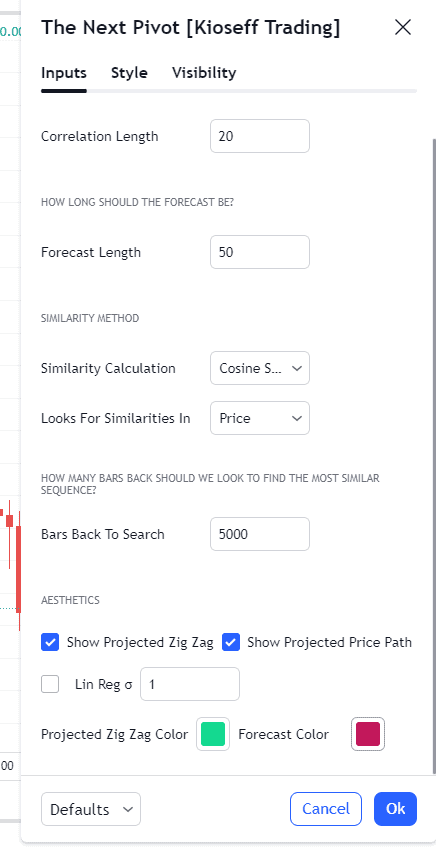
In my experience, there is one error in the script. The most crucial prediction line in settings is white, the same as the background, and is not visible. You need to change to b some other color:
Interestingly, the script doesn’t rely on a single statistical method to determine the similarity between sequences. Instead, it employs various techniques, such as Spearman, Pearson, and Kendall correlation coefficients, offering a different perspective on the relationship between two data sets. Additionally, it uses methods like Absolute Difference, Cosine Similarity, and Mean Squared Error, which provide varied angles of analysis, from direct comparisons to more nuanced, angle-based similarities.
Another notable feature is the forecasted linear regression channel. This tool aspect provides a structured view of potential price movements within a defined path, making it easier for traders to visualize where the market might head shortly.
The tool is designed with flexibility, allowing users to customize aspects like colors and even the length of historical data to scan, depending on the load times and practicality. However, it’s important to note that while the tool can provide insightful projections, these are based on historical similarities and may not always accurately predict future market movements. Many factors influence financial markets, and historical patterns don’t always repeat themselves in the same way.
The script’s approach, finding the most similar price sequence to the current market situation and then using the subsequent price movement of that historical sequence as a basis for prediction, is an exciting methodology. However, users should be aware that markets are subject to random fluctuations, and what may appear as a pattern could sometimes be a coincidence.
Let us make a summary of this indicator:
- Advanced Pattern Recognition: “The Next Pivot” script uses similarity measures to match the current price sequence with historical sequences, identifying the most similar pattern from up to 100 bars back.
- Forecasting Capabilities: It projects future price movements for up to 250 bars, providing insights into potential market directions, including price paths and ZigZag patterns.
- Utilizes Multiple Statistical Methods: The script uses statistical techniques such as Spearman, Pearson, Kendall correlations, Absolute Difference, Cosine Similarity, and Mean Squared Error to analyze and compare price sequences.
- Forecasted Linear Regression Channel: This channel represents potential future price movements within a defined path and aids traders in their market analysis.
- Customizable Features: This feature allows the customization of visual elements like colors and the scope of historical data analysis, adapting to user preferences and system capabilities.
- Flexible Historical Data Analysis: It can scan all available bar history for a correlating sequence, although practical limitations may apply based on forecast length, correlation length, and chart data volume.
- Caveats on Predictive Reliability: While providing valuable insights, the script’s projections are based on historical similarities that may not always repeat in the future, highlighting the unpredictability of financial markets.
TRADINGVIEW PRO AD-FREE CHARTS

He is an expert in financial niche, long-term trading, and weekly technical levels.
The primary field of Igor's research is the application of machine learning in algorithmic trading.
Education: Computer Engineering and Ph.D. in machine learning.
Igor regularly publishes trading-related videos on the Fxigor Youtube channel.
To contact Igor write on:
igor@forex.in.rs
