Table of Contents
As a forex trader, you may have thought of various ways to enter and exit a trade at the right time to gain profit, right? One such way is forex technical analysis. Forex technical analysis is viral among the market players and can be done using charts and trade indicators. Though you are new to this field, this article will clear all your doubts about forex technical analysis and how it can help you predict market trends.
Forex Technical Analysis for Beginners
Technical analysis evaluates assets by analyzing market activity-generated statistics such as past price levels, time, and volume. It uses charts and other tools to identify patterns and trends that suggest future market movements, relying on the premise that historical trading activity and price changes can be valuable indicators of future price movements.


The difference between the fundamental and technical analysis is that while fundamental analysis considers economic changes and related aspects as the primary contributors, the technical analysis considers past trends. A trader needs to be aware of fundamental and technical analysis basics to take advantage by combining them.
Technical Analysis advantages
Technical analysis is an excellent tool for risk management to prevent downside risk. By understanding the principles and various forex technical analysis concepts, traders can develop suitable strategies for trading different currencies. Unlike fundamental analysis, which helps derive the market’s intrinsic value, technical analysis helps find trends and patterns caused by fundamental changes.
There are three main benefits of implementing technical analysis in forex trading.
- Identifies Trends: Technical analysis helps identify market trends, allowing traders to make informed decisions based on past market patterns.
- Improves Timing: It aids in determining optimal entry and exit points, which is crucial for maximizing profits and minimizing losses.
- Reduces Emotional Trading: Relying on objective data and chart patterns helps reduce the impact of emotional decision-making in trading.
- Offers Flexibility: Applicable across different markets and timeframes, making it a versatile tool for traders and investors.
- Enhances Risk Management: Technical indicators can be used to set stop-loss orders and manage risk more effectively.
- Provides Clear Signals: Utilizes chart patterns and technical indicators to provide clear buy and sell signals.
- Supports a Range of Strategies: Compatible with various trading strategies, from day trading to swing trading and long-term investing.
- Backtesting Potential: Allows backtesting strategies using historical data to assess their effectiveness.
- Accessible to All Levels: Useful for both beginners and experienced traders due to its visual nature and the wide availability of educational resources.
- Integrates with Fundamental Analysis: Can be combined with fundamental analysis for a more comprehensive market analysis.
The best forex technical analysis tools
The best forex technical analysis tools are:

- Previous support and resistance price levels (for example, last 200-day high or low)
- Trend lines
- Relative Strenght Index RSI or MACD indicator Oscilattors
- Fibonacci levels
Previous support and resistance levels, such as the last 200-day high or low, are crucial in technical analysis as they indicate the price points the market repeatedly struggles to break through. These levels are based on historical data, where the price has previously encountered buying (support) or selling (resistance) pressure. For example, if a stock consistently fails to rise above a specific price, that becomes a resistance level, suggesting a price ceiling. Conversely, a support level is where the price tends to find a floor as buyers step in to prevent further decline.
Trend lines are drawn by connecting the highs or lows in a price chart to depict the market’s general direction. An upward trend line connecting higher lows indicates a bullish market, while a downward trend line connecting lower highs suggests a bearish market. These lines help traders identify potential reversal points and forecast future price movements based on historical trends.
The Relative Strength Index (RSI) and Moving Average Convergence Divergence (MACD) are popular oscillators in technical analysis. RSI measures the speed and change of price movements, typically on a scale of 0 to 100, to identify overbought or oversold conditions. A reading above 70 often suggests a market is overbought, while below 30 indicates oversold conditions. The MACD, the other hand, is a trend-following momentum indicator that shows the relationship between two moving averages of a security’s price. It helps traders identify potential buy and sell signals based on when the MACD crosses above (bullish signal) or below (bearish signal) its signal line.
Fibonacci levels are based on the Fibonacci sequence, a series of numbers where each is the sum of the two preceding ones. In trading, key Fibonacci ratios – 23.6%, 38.2%, 61.8% – are derived from this sequence and used to identify potential support and resistance levels. These levels are seen as natural correction points in a market trend. Traders use them to predict areas of interest for market movements, with the 61.8% level, also known as the “Golden Ratio,” being particularly significant. Fibonacci retracement levels are drawn by taking two extreme points (usually a peak and trough) on a stock chart and dividing the vertical distance by the key Fibonacci ratios. This technique helps traders anticipate and react to potential trend reversals in the market.
Forex technical analysis Tool – Charts
Historical charts are very useful in forex technical analysis. A chart consists of the past and present market price, which is the starting point to decide how profitable trade can be. The market price is the most significant representation of the market and thus holds the most importance.
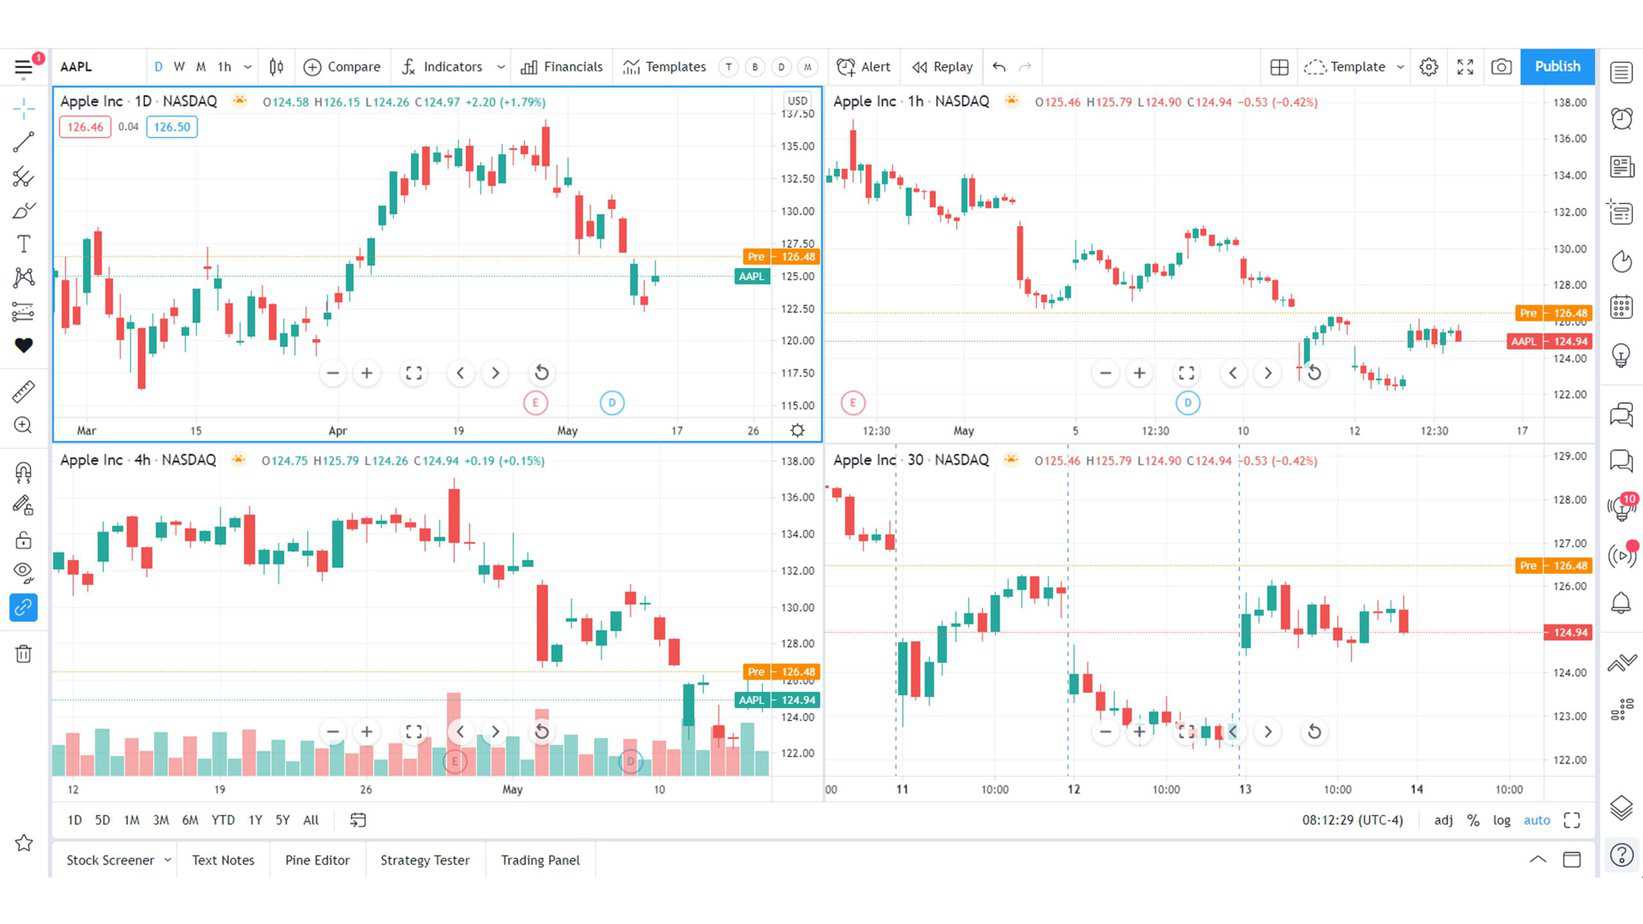
Technical charts can help derive the overall market trend by deciding whether the market would soar or slump over any time frame, including hourly, daily, weekly, or monthly. Prices are monitored in candlestick patterns (for example, cup and handle patterns) or charts, known as price ranges. The commonly used charts are bar charts, candlestick charts, and line charts.
A technical chart has four main points – the opening price, the closing price, the high point, and the low point. The relationship between the prices and the pattern can give signs to traders for entering and exiting trades. By understanding forex technical analysis basics, beginners can implement and combine the charts and indicators to forecast the future.
What are Forex Technical Analysis Indicators?
Forex technical analysis indicators are helpful when a trader is looking for an opportunity to trade. Most technical analysis indicators are based on volume and price, just like the charts. An indicator aids in finding the support and resistance levels and how long a trader should hold the trade. A trader can get the current market perspective by utilizing multiple time frame analyses for price or volume-based ranges and changes.
These are some of the most used forex technical analysis indicators,
- Relative Strength Index (RSI)
- Moving Averages
- Moving average convergence divergence (MACD)
- Bollinger Bands
- Stochastics
- MACD
While MACD and moving averages are vital for finding market trends, RSI identifies the entry and exit points.
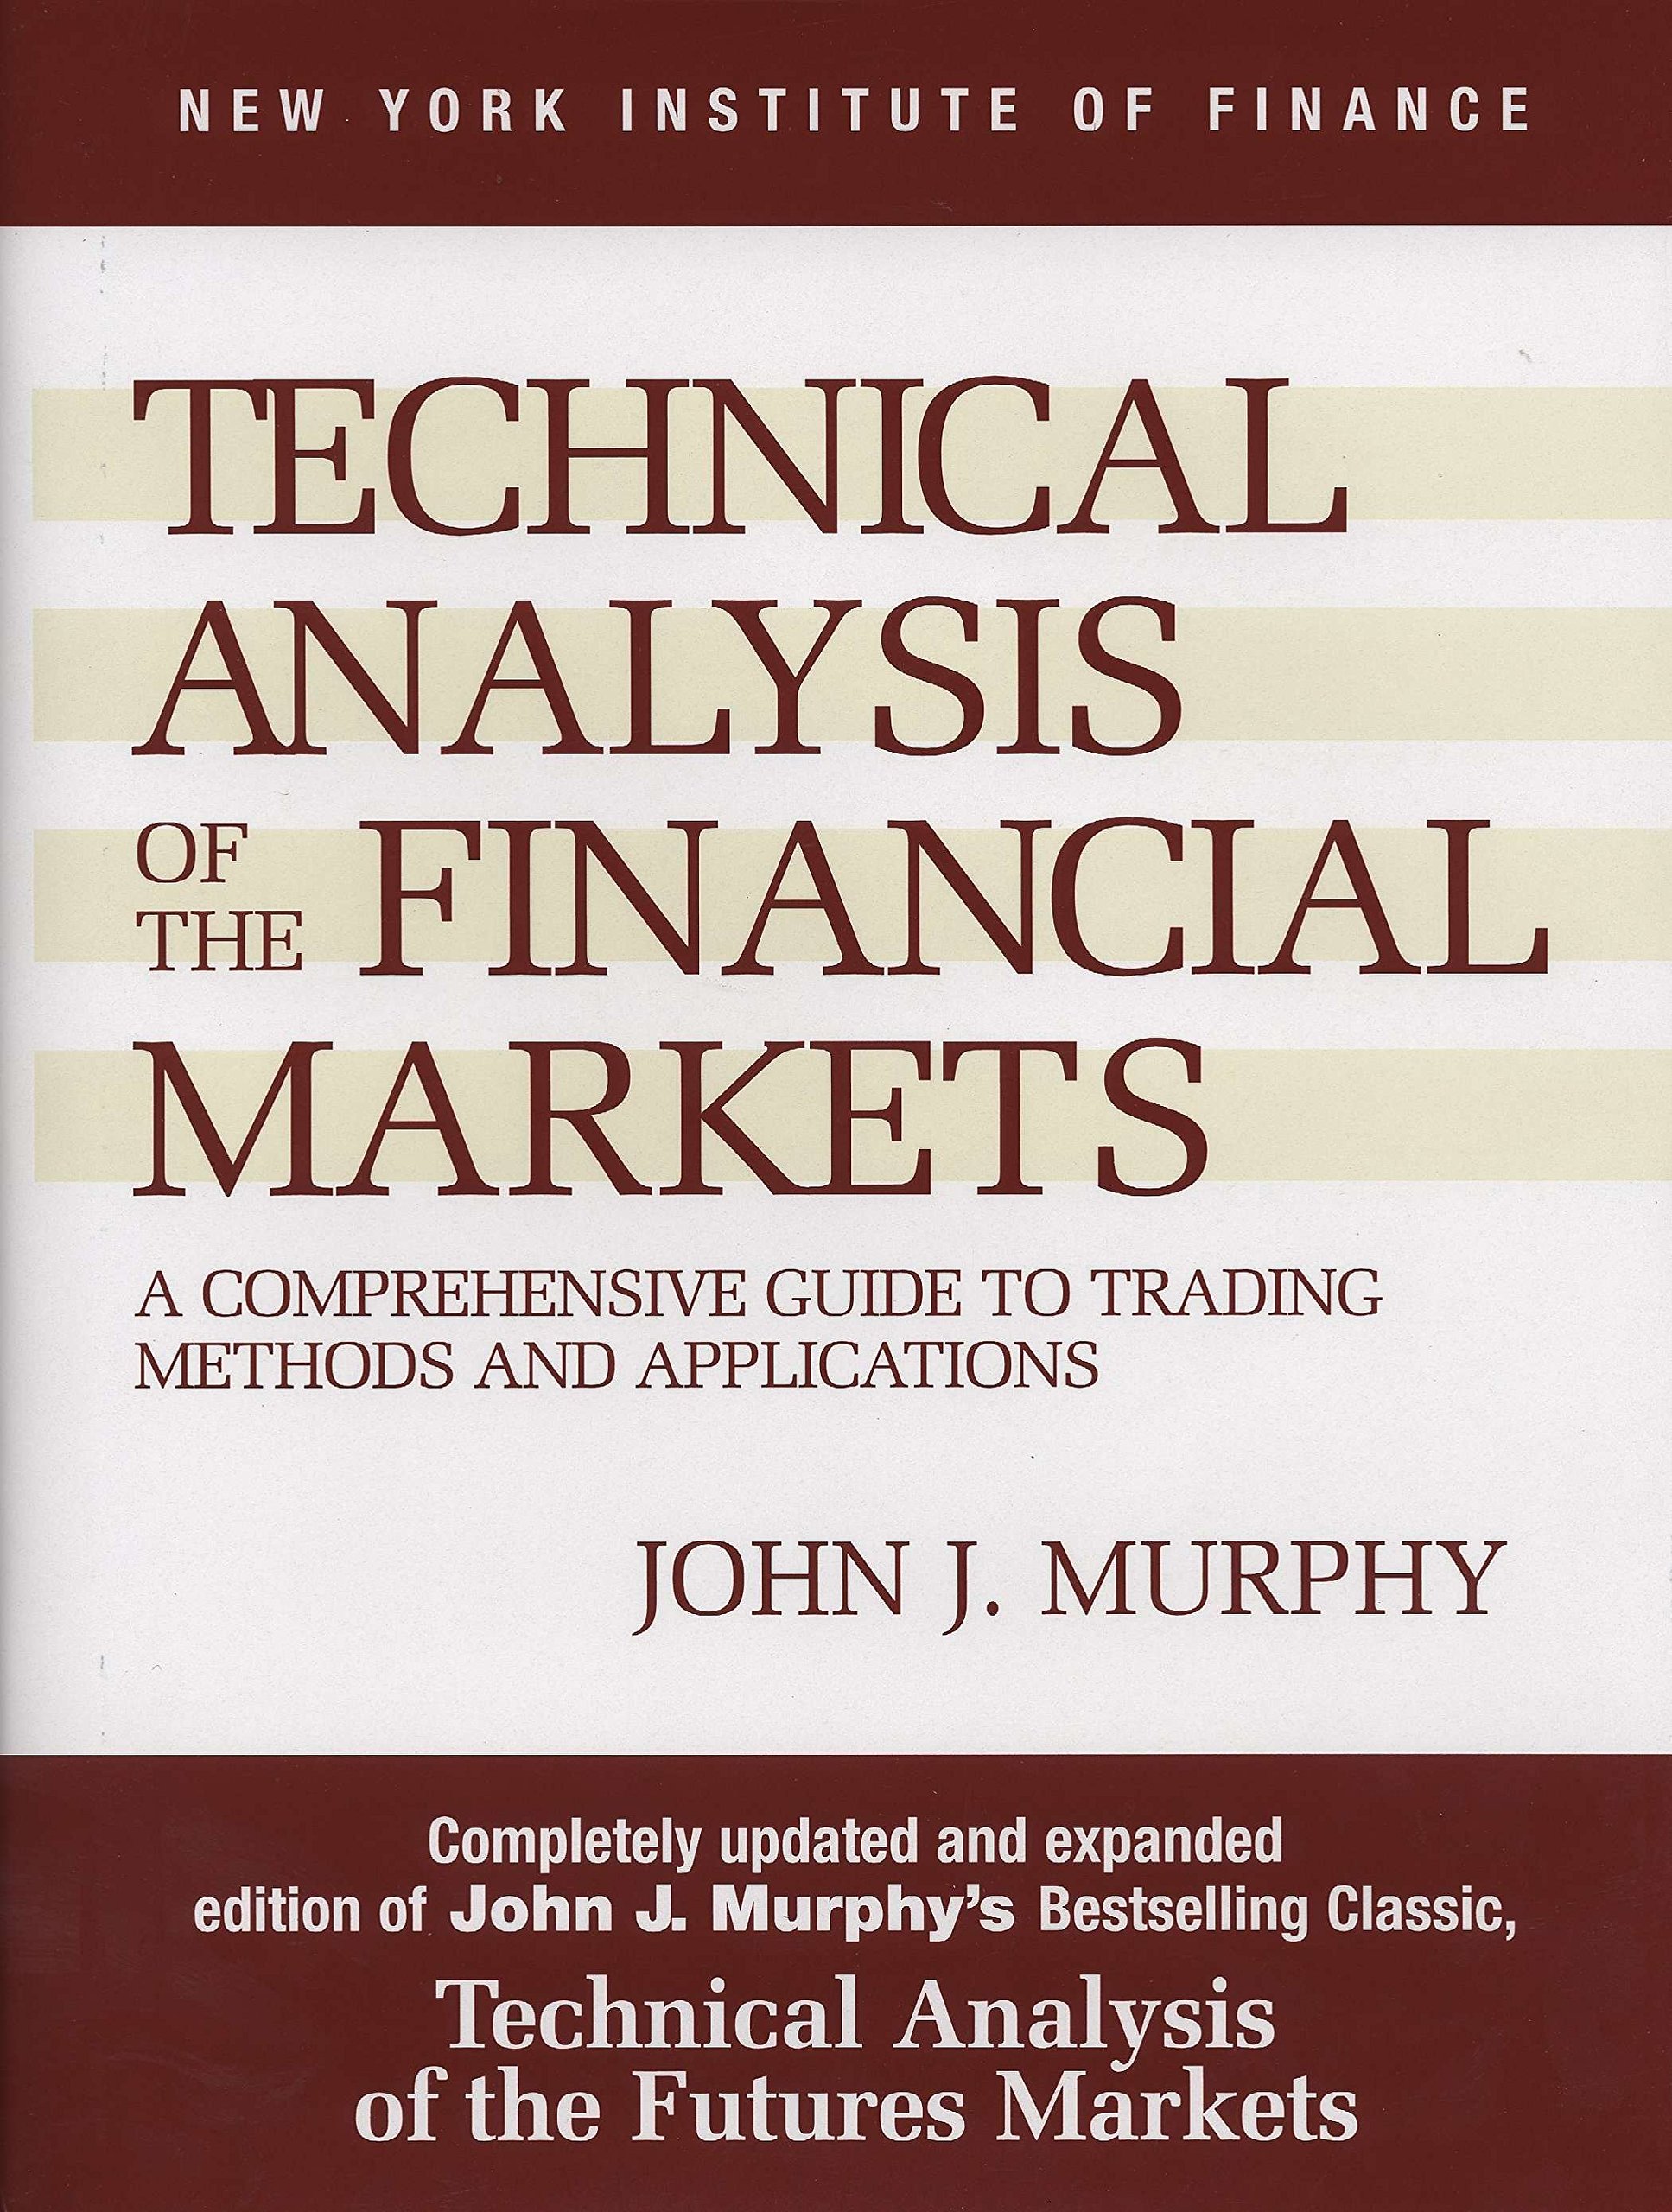
The most crucial step is to read an excellent technical analysis book:
Technical Analysis of the Financial Markets, by John J. Murphy
This book is written in straightforward language; you should read it along with the first book to fully understand its content. This is the best book written about forex and stock trading, in my opinion. This is a University book.
Let’s start with the essential things in technical analysis:
1) Oscillators technical indicators
2) RSI Oscillator
In this video, you can learn everything about RSI and how to use it in analysis:
3) Trend lines as an essential tool in trading for each beginner trader is presented below:
4) When you learn trend lines, the next thing to learn are Fibonacci levels, which are presented in the video below:
5) The next thing that novice traders need to learn are candlestick patterns that are presented below in the video:
These are significant things to learn in technical analysis.
Conclusion
As a beginner in the forex market, you can also keep yourself updated with the latest trends, news, and events happening across the globe. It would give you a good edge over your trades as the forex market is susceptible to global events.
As a novice trader, you are advised to trade on a practice account and can try different technical analysis patterns and tools on those dummy systems to learn new things. By doing so, you would make mistakes but won’t lose your actual money. You can find such demo accounts from brokers worldwide, as it has become a trend in current times.
You should also not fall into any “Get your profit doubled in a month” kind of scams (read our article about forex scams), as nothing in this world gives you easy money without skills and hard work involved. Ultimately, it’s about how much you are passionate about trading, how much knowledge you have, and how much you are willing to learn through your mistakes.

He is an expert in financial niche, long-term trading, and weekly technical levels.
The primary field of Igor's research is the application of machine learning in algorithmic trading.
Education: Computer Engineering and Ph.D. in machine learning.
Igor regularly publishes trading-related videos on the Fxigor Youtube channel.
To contact Igor write on:
igor@forex.in.rs
