Table of Contents
One of the first theories college students learn in Economy is the Dow theory.
What is the Dow Theory?
The Dow Jones theory or Dow Theory describes market trends, price action, and market philosophy. Charles Dow developed it in the late 19th century.


In this market philosophy, there are three main assumptions:


- Manipulation of the primary trend is not possible.
- The market reflects all available information. Sometimes good news will not raise the price of the asset.
- The theory is not infallible. Using the Dow theory, traders can not beat the market. This is more market philosophy than trading strategy.
This article will describe how we can use basic market philosophy to consider the bear market.
Dow Theory Rules:
- Everything gets Discounted in the Market
Dow Theory operates on the efficient market hypothesis (EMH), stating that prices of assets incorporate the available information. This approach is behavioral economics antithesis.
Potential of earnings, management competence, competitive benefits, all such factors, and a lot more get priced in the market, even when not all individuals know such details. With stricter theory readings, all future events get discounted in risk form.

- Primary Trends are Available in Three Phases
Accordingly, with the Dow Theory, the primary trend passes through three phases. In a bear market, these are the public participation, panic, and distribution phase, and in a bull market, they’re the public participation, accumulation, and excess phase.
- Trends are always confirmed by volume.
Volume increases when the price moves in the primary trend direction and decreases when it moves against it. The low-volume signals are a weakness in the movement. Let’s suppose in the bull market; the volume must increase upon rising price and also falls with secondary pullbacks. If in such an example, the volume picks during pullback, this would signify a reversing trend as many market participants would turn bearish.
- Trends Persist Until there is Clear Reversal.
Primary trend reversals are often confused with secondary trends. Thus, it would be difficult to determine whether the bear market upswing becomes short-lived or a reversal rally to get followed through lower lows. Dow’s theory must advocate caution, insisting that possible reversal must get confirmed.
- Stock market averages must confirm each other.
A logical relationship between the stock market averages in Dow theory requires them to confirm each other for a bull market to be considered healthy and sustainable. This is because manufacturers’ performance, as reflected by stock prices in the industrial average, is closely linked to the performance of railway companies, which act as key shippers of manufactured goods to consumers.
In a strong bull market for manufacturers, there must also be a corresponding rally in the rail stocks. This indicates that orders for manufactured products are increasing, and businesses can ship their goods efficiently and cost-effectively. This provides confidence that the economy is growing and thriving, which helps drive further gains in stock prices across all market sectors.
Ultimately, the Dow theory offers an important framework for investors looking to identify when conditions are right for long-term market growth and stability. It helps to identify changes and trends early so that investors can make well-informed decisions about how they want to position their portfolios.
- The stock market discounts all news
One of the core principles of Dow theory is that stock prices are inherently efficient, meaning that they reflect all available information at all times. This means that new information quickly impacts stock prices and moves them in response to this new data. As such, Dow theory agrees that the stock market discounts all news, reflecting it as soon as possible in stock prices and allowing investors to make decisions based on up-to-date information.
Is Dow Theory Still Relevant?
The Dow Theory is still relevant today because it focuses on the emotional aspects of the market, which remain a key component of market trends. By analyzing how investors respond to various events and situations, we can understand how markets move and what drives those movements.
Furthermore, the Dow Theory provides us with practical tools and techniques for identifying market trends and anticipating major shifts in investor sentiment. This makes it an invaluable tool for anyone who wants to succeed in today’s dynamic and constantly changing financial landscape.
Even today, you can see that Charles Dow’s rule about news and the market is the same as the efficient-market hypothesis (EMH), which states that asset prices reflect all available information. Dow’s theory aligns with the efficient-market hypothesis, proving it is still relevant.
One proof that Dow theory is still relevant is the Dogs of the Dow strategy that investors use even in 21. century. The Dogs of the Dow strategy is a simple and effective investment strategy that aims to outperform the broader market by focusing on high-yielding stocks. This strategy generally involves selecting the top 10 highest-yielding stocks from the Dow Jones Industrial Average (DJIA) at the beginning of each year, holding them for a full year before selling them, and rebalancing your portfolio at the start of the next year.
There are several key advantages to using this strategy. For one, it is easy to implement and requires little time or effort. Additionally, because it focuses on high dividend yields, it has historically been shown to outperform other indices like the DJIA or S&P 500 over long periods of time.
However, there are also some potential downsides to using this strategy. For one, since it focuses only on dividends and not total returns, there is an increased risk that prices may decline during unfavorable economic conditions or bear markets. Additionally, while not always the case, some market inefficiencies in these high-yield stocks can make them more volatile than other types of investments.
As with any investing strategy, whether or not you should use Dogs of the Dow will depend largely on your individual investment goals and risk tolerance. However, if you are looking for an easy way to potentially boost your returns over time and have a relatively low risk tolerance level, this might be a good choice.
What is Dow theory Sell signal?
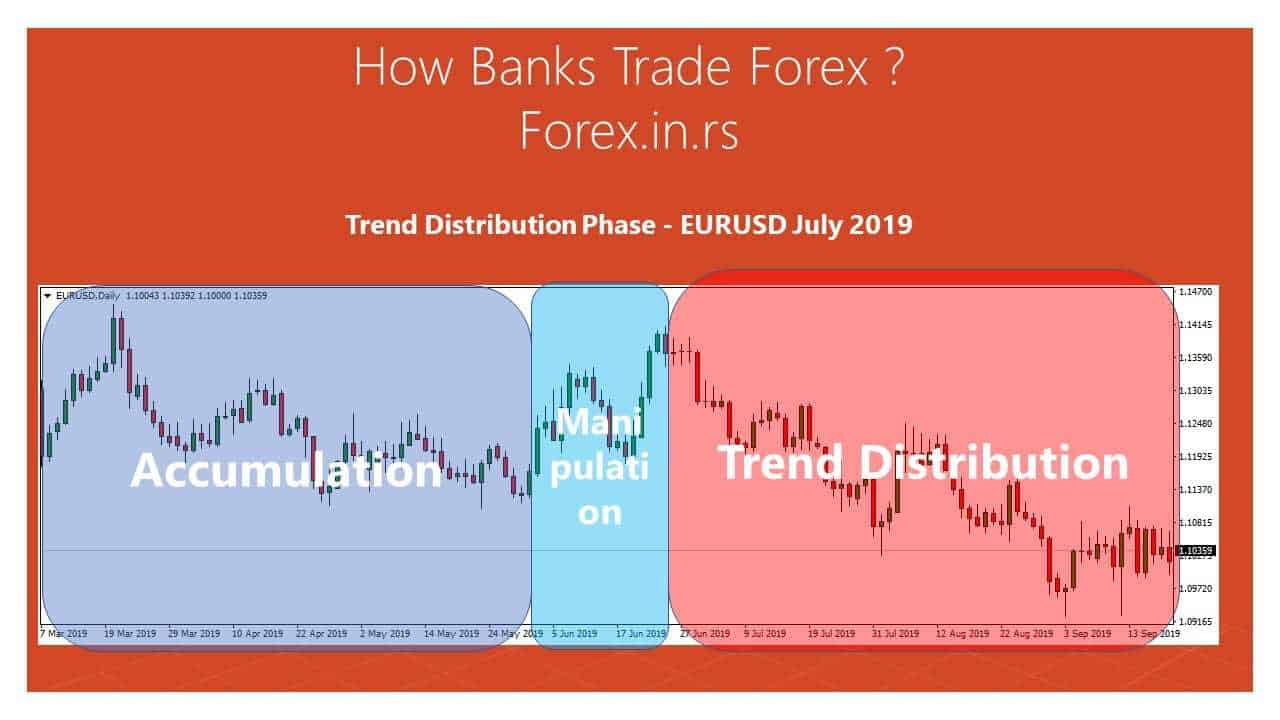
Dow Theory Sell Signal is usually after the distribution phase, where we can see a strong bearish move. Stage two is critical for a massive price drop because the next days and weeks’ worth can follow the bearish trend. Of course, false reversals and false trends are very common in volatile markets, and very often next market prediction move is tough to estimate. In the article How banks trade forex, we analyze the phases of trading deeply. This article will connect this approach with Dow’s theory and practical example. When we trade some long-term trade, it is important to recognize three main phases.
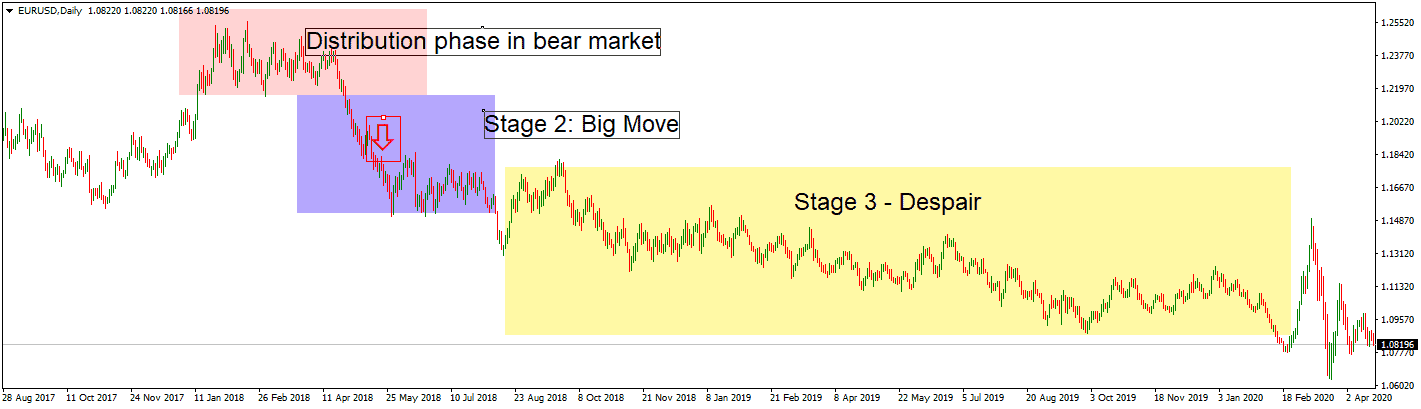
In stage 2, Big move, we see a massive price drop. Usually, in forex trading or stocks, the price will very fast (in a few days) drop below EMA200 moving average after the distribution stage. This is the period where technical indicators show oversold conditions. Beginners traders often try to buy the asset at this moment and usually make mistakes. Usually, the following days and weeks’ prices will try to make new lows, and the bearish trends can not be finished so fast. Long-term traders increase sell positions, and many enter into a trade for the first time. The next phase, Stage 3 – Despair, is the slow bearish trend and can be present for a very long time.
Among the most relied-upon theories in financial market history is the Dow theory. Whether you’re into short-term stock market trading, an intraday trader, or are looking for long-term investment, knowing this certainly helps in having a lot of strategies. He founded Dow Jones’s financial service WSJ (Wall Street Journal) and was Dow Jones Company co-founder. Even post-100 years, Dow Theory would still be considered and dominated as the most sophisticated contemporary study meant for technical analysis.
Presently, these beliefs are pretty relevant to the stock market. Also, Further, the Dow theory was developed by including the contributions put up through William Hamilton in the 1920s and Richard Russell and George Shaefer in the 1960s.
Dow Theory History
According to Dow Theory, the market is an upward trend when one of the averages (transportation or industrial) advances more than the previous critical high and gets followed and accompanied by similar advances in another average.
Dow Theory is a popular trading approach developed by Charles H. Dow with Charles Bergstresser and Edward Jones, who founded Dow Jones & Company, Inc. and developed DJIA. The theory was fleshed out with editorial series in the Wall Street Journal, which was co-founded.
In 1902, Charles Dow died, and because of their death, the complete story wasn’t published on markets, but various associates and followers had published works that got expanded on editorials. Some vital contributions to Dow Theory are as follows:
“The Dow Theory Today” by Richard Russell (1961)
“The Stock Market Barometer” by William P. Hamilton (1922)
“The Dow Theory” by Robert Rhea (1932)
Dow had a theory that the entire stock market was ideal for identifying business conditions within the economy after analyzing the market, accurately gauging such situations, and identifying significant trends in the market that are most likely individual stock direction.
Even though being a theory up to a hundred years old, the Dow Theory remains relevant in the present trading market.
This is due to the understanding of Dow Theory helps traders to benefit through exploiting and spotting trends in the market. The most crucial criticism of Dow Theory is that it is not a scientistic theory – it is more market philosophy. No scientific proof exists that this theory can be applied in every market situation. Traders can use Dow sell signal market philosophy to analyze bearish movement (and bullish too) and to understand phases. Very often, when I see the big picture, daily and weekly charts, I can make better decisions as a trader.
Dow theory as market philosophy is still relevant!

He is an expert in financial niche, long-term trading, and weekly technical levels.
The primary field of Igor's research is the application of machine learning in algorithmic trading.
Education: Computer Engineering and Ph.D. in machine learning.
Igor regularly publishes trading-related videos on the Fxigor Youtube channel.
To contact Igor write on:
igor@forex.in.rs
