Table of Contents
The Commitments of Traders (COT) trading report, a treasure trove of insights, reveals the positioning and sentiments of significant participants, enabling astute investors to decipher the trends that shape the gold market.


Like a backstage pass to the financial arena, the COT trading report lifts the curtain on the strategies employed by commercial, non-commercial, and non-reportable traders. Among these groups, commercial and non-commercial traders take center stage, dictating market movements and potentially heralding dramatic price reversals.


As you navigate the COT report, you’ll uncover the intricate dance between these market players. Analyzing their net positions – the difference between their long (buy) and short (sell) contracts – offers a window into prevailing sentiment. A substantial net part hints at a prevailing bias, and keen observers can discern signs of market exuberance or caution.
COT Report Trading Strategy
The COT Report Trading Strategy is predominantly a long-term position trading strategy that uses solid/weak currency determination and reversal COT report analysis.
Please see my youtube video from Fxigor youtube channel, where I described in detail COT Report Trading Strategy:

Let us see COT Report Trading Steps image below:
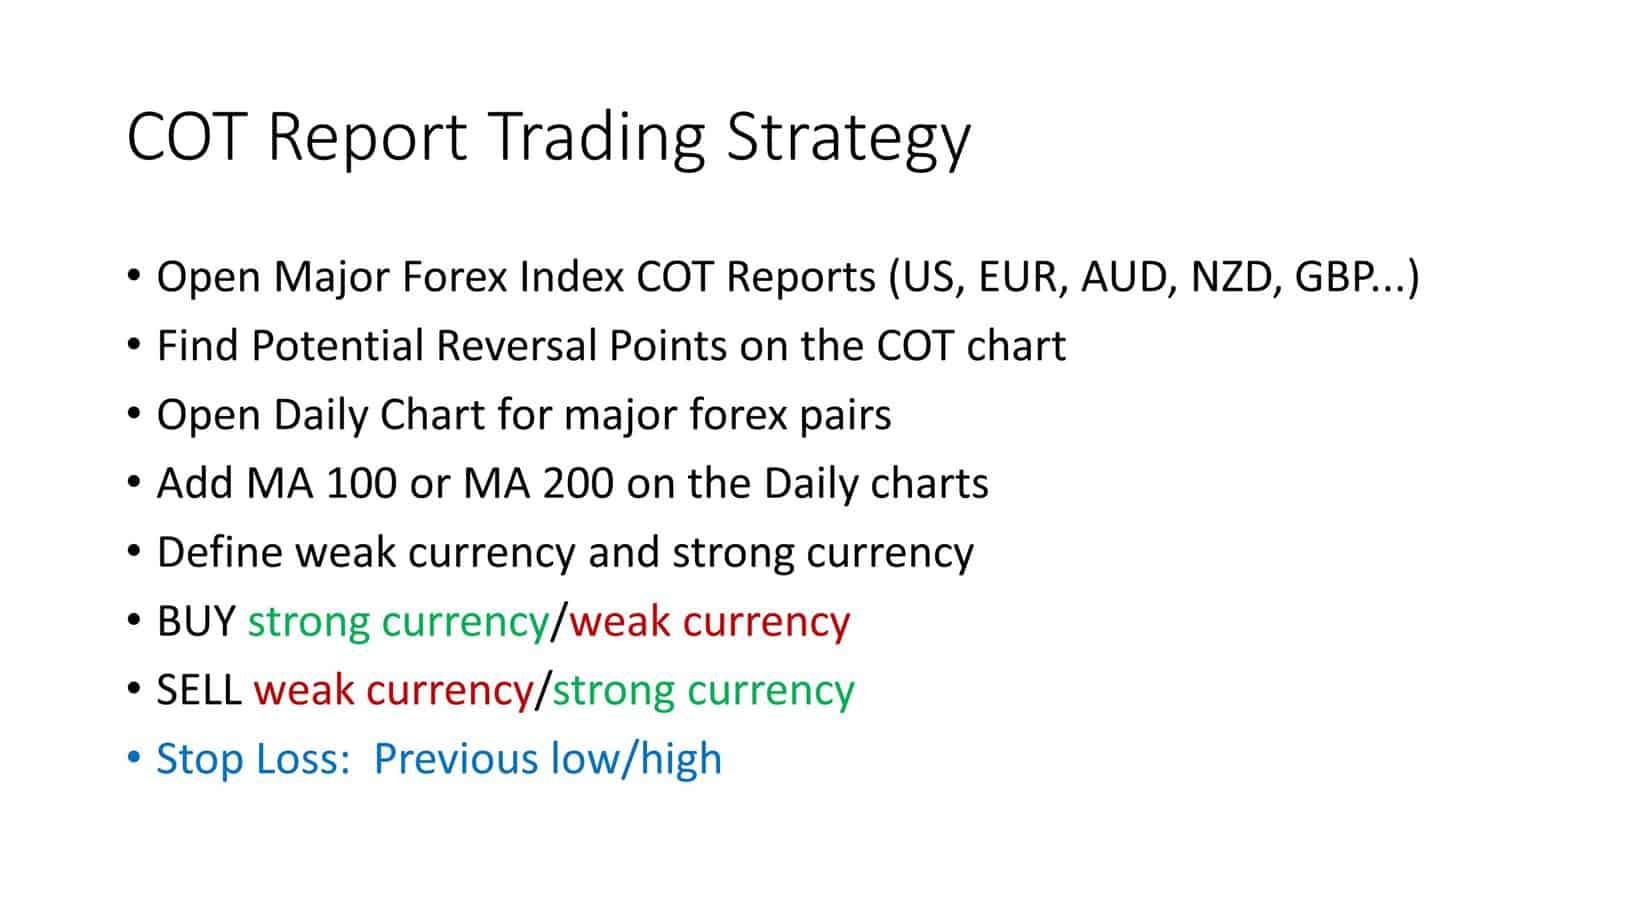
COT Report Trading strategy steps:
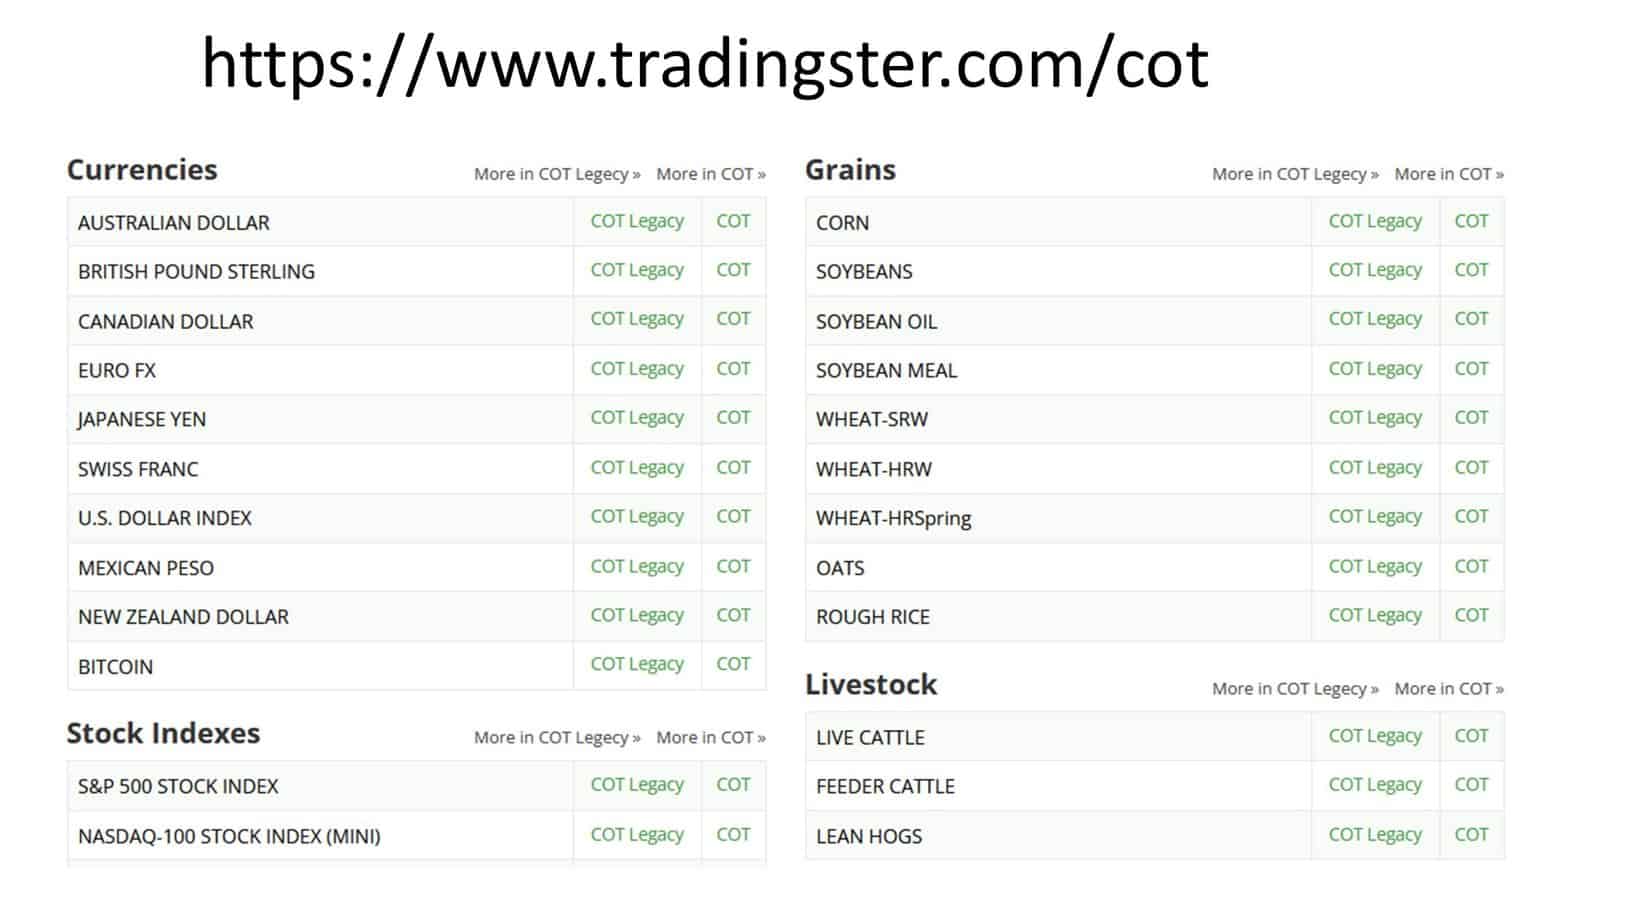
- Begin by opening the primary Forex index COT reports for currencies such as the US dollar (USD), euro (EUR), Australian dollar (AUD), New Zealand dollar (NZD), and British pound (GBP). Use tradingster.com/cot
- Analyze the COT charts to identify potential reversal points. Look for significant changes in positioning, extreme levels, or deviations from historical norms that may indicate a shift in market sentiment.
- Open the daily charts for the major Forex pairs you are interested in trading.
- Add a moving average (MA) of 100 or 200 periods to the daily charts. This helps identify the overall trend and provides additional confirmation for potential trade setups.
- Determine the relative strength between currencies. Define which currency is weak and which is firmly based on the analysis of the COT report and other factors such as economic data and fundamental analysis.
- Look to BUY the strong currency against the weak currency or SELL the weak currency against the strong currency. This allows you to take advantage of the perceived strength or weakness in the respective currencies.
- Set your stop loss level based on the previous low or high on the price chart. This helps manage risk by defining the point at which you would exit the trade if the price moves against you.
Position traders aim to capture substantial price movements over extended periods, ranging from several weeks to months, by analyzing the data provided in the Commitments of Traders (COT) report.
The COT report offers a comprehensive overview of the positions held by various market participants, including commercial traders, non-commercial traders (speculators), and non-reportable traders. Position traders can gain insights into market sentiment and potential trends by studying the positioning and changes in these categories.
Given the nature of the COT report, released every week, the strategy suits traders with a longer-term outlook and willing to hold positions for extended periods. Position traders typically look for significant shifts in positioning, extreme levels, or changes that deviate from historical norms. These indicators may suggest potential turning points or reversals in the market.
Position traders combine the information from the COT report with other forms of technical and fundamental analysis to make well-informed trading decisions. For example, they may consider chart patterns, trendlines, support and resistance levels, and other indicators to validate their analysis and time their entries and exits.
How to analyze COT report?
To analyze the COT report for possible reversal moments using either the non-commercial and commercial overlap or maximum distance on the chart, you can follow these steps:
- Obtain the COT report: Access the latest COT report for the specific market you are interested in, such as futures contracts for commodities or currencies. The report is on the Commodity Futures Trading Commission (CFTC) website or through financial news platforms.
- Identify the non-commercial and commercial categories: The COT report categorizes traders into non-commercial (speculators) and commercial groups. Non-commercial traders are typically large speculators, such as hedge funds, while commercial traders consist of entities using the futures market for commercial purposes.
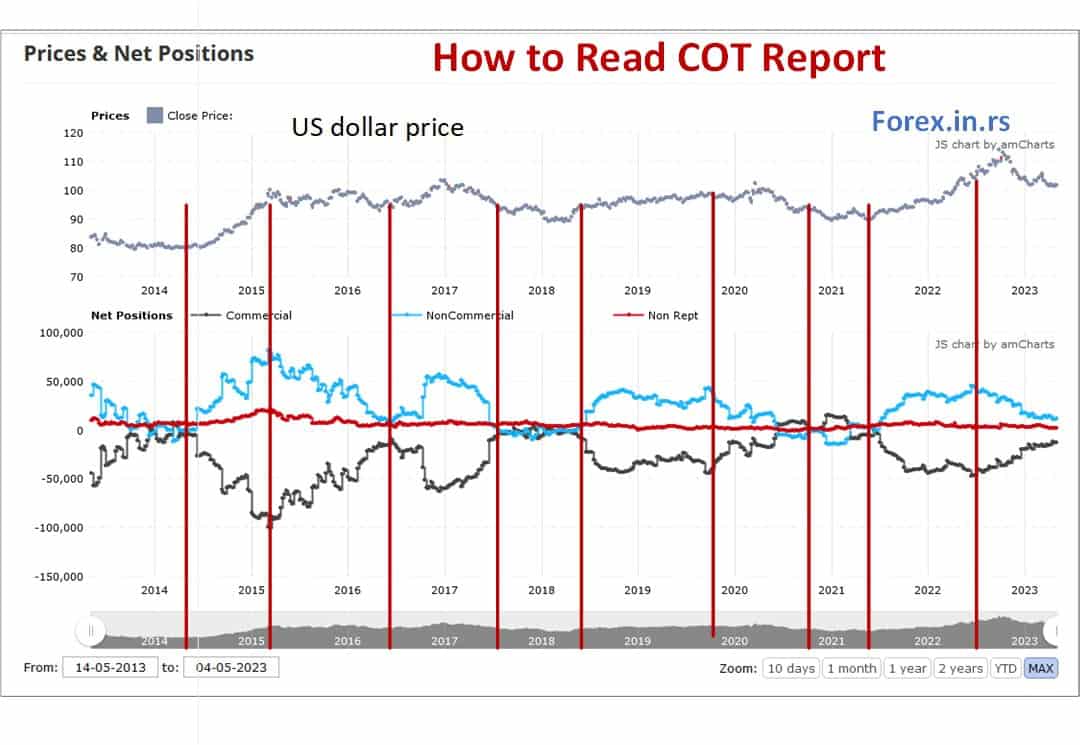
- Analyze positioning overlap: Focus on the overlap between non-commercial and commercial traders. Look for periods where their positions align or overlap significantly. This can indicate a convergence of sentiment and potential market turning points.
- Study maximum distance on the chart: Pay attention to moments where non-commercial and commercial positions are at maximum distance from each other. This indicates a divergence in sentiment, with non-commercial traders holding extraordinarily bullish or bearish positions compared to commercial traders. These moments can also suggest potential market reversals.
- Compare positioning with historical data: Examine the current positioning overlap or maximum distance on the chart in the context of historical data. Look for patterns or instances where similar positioning preceded price reversals in the past. This historical perspective can provide insights into the potential significance of the current positioning.
Let us see the image from the previous article, How to read COT report below:
COT Report Trading Strategy EURUSD Example
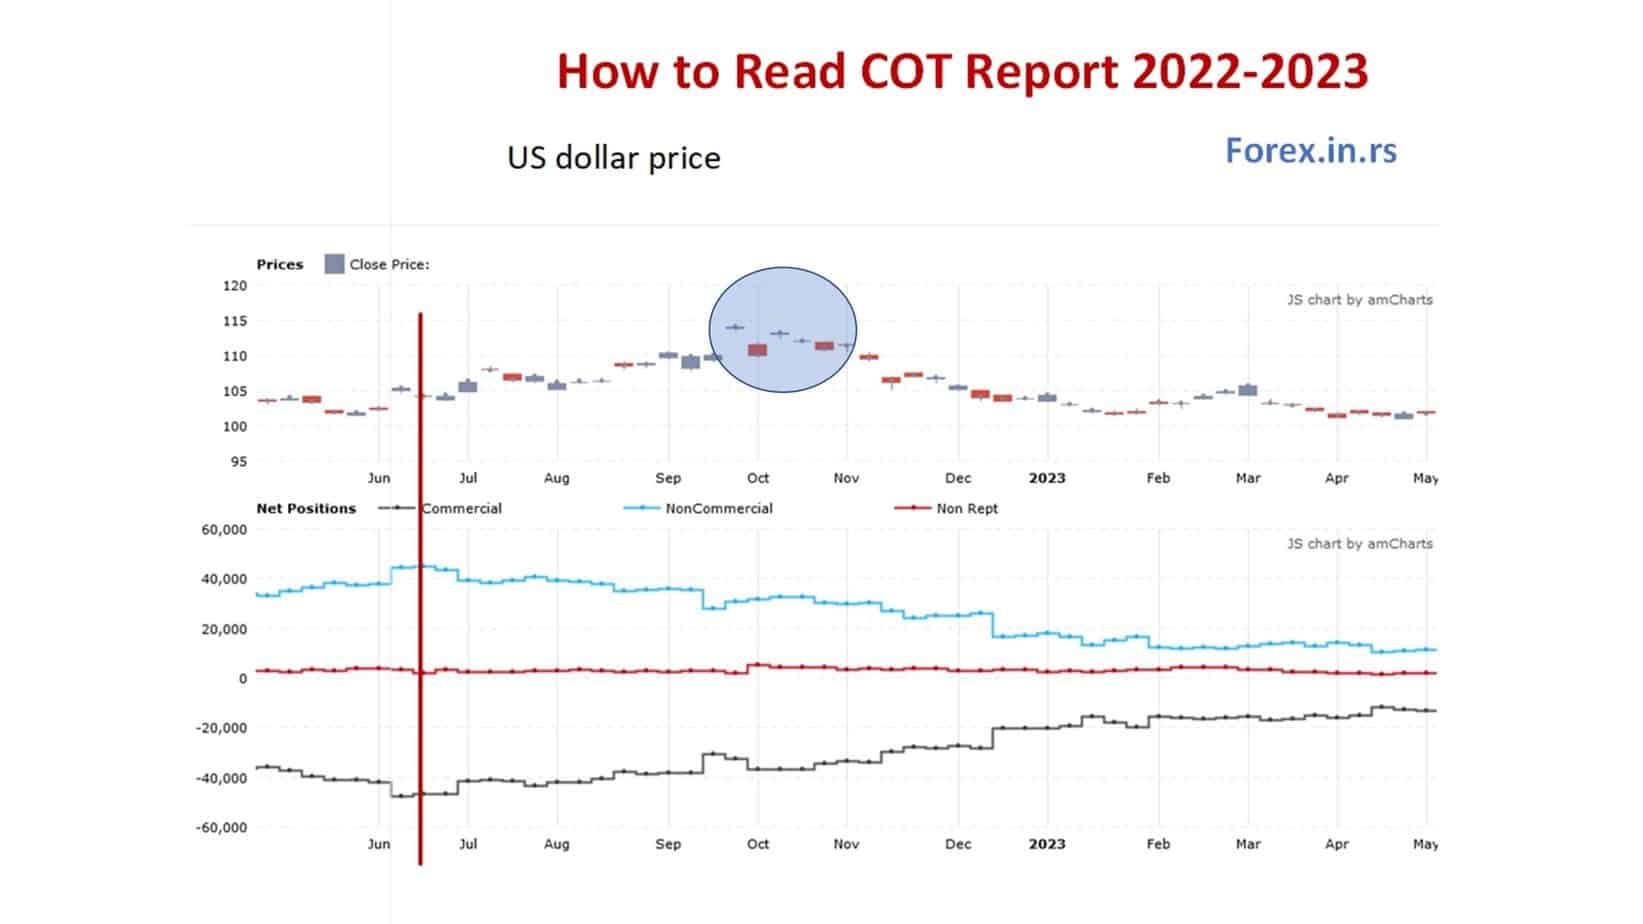
First, we will analyze the bullish to bearish reversal on the US index COT report:
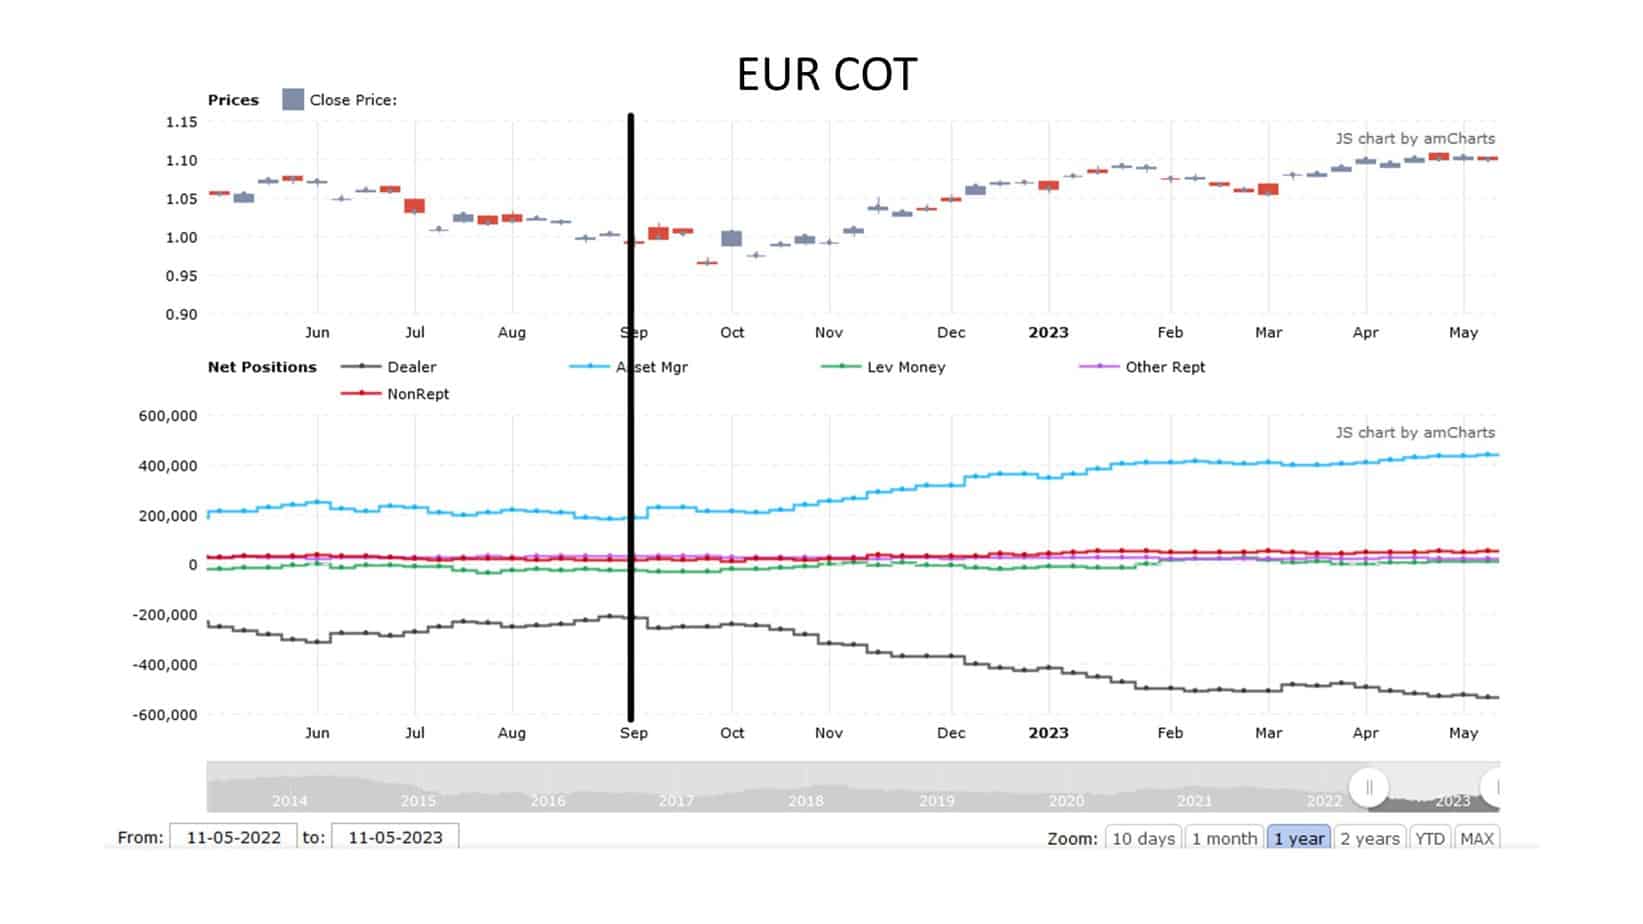
Then, we will explore the bearish to bullish reversal on the EUR index COT report:
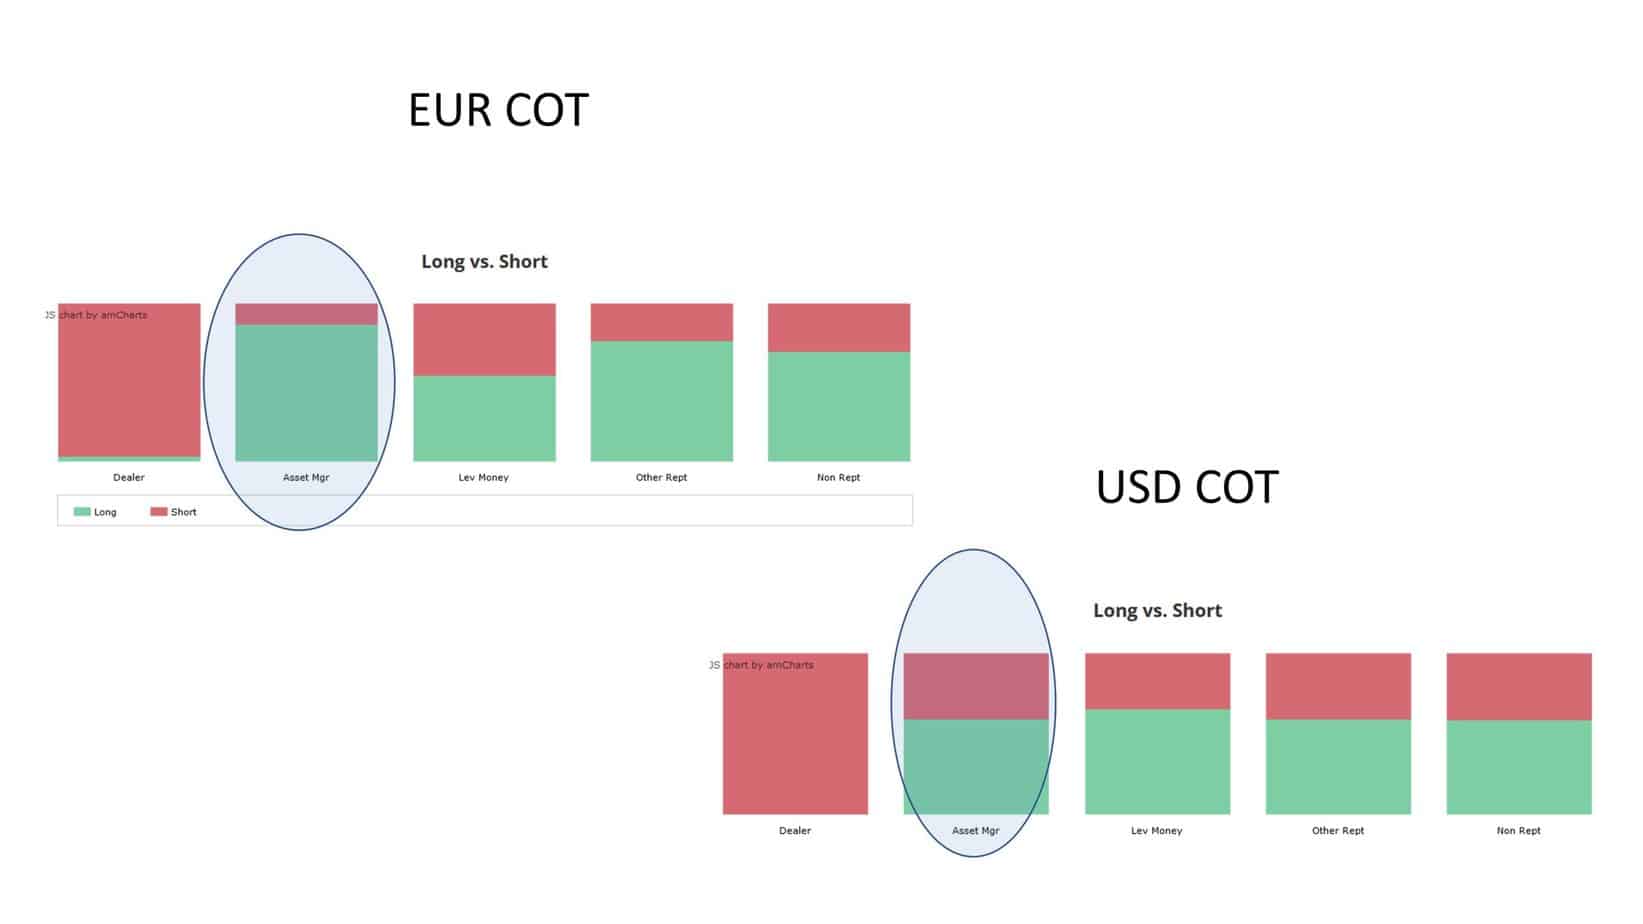
In the next step, we will check will this reversal can last. We want less than 90% of institutional traders to be in some direction if we have a a 100% to 0% long vs. short trend. See May 2023. COT report long vs. short:
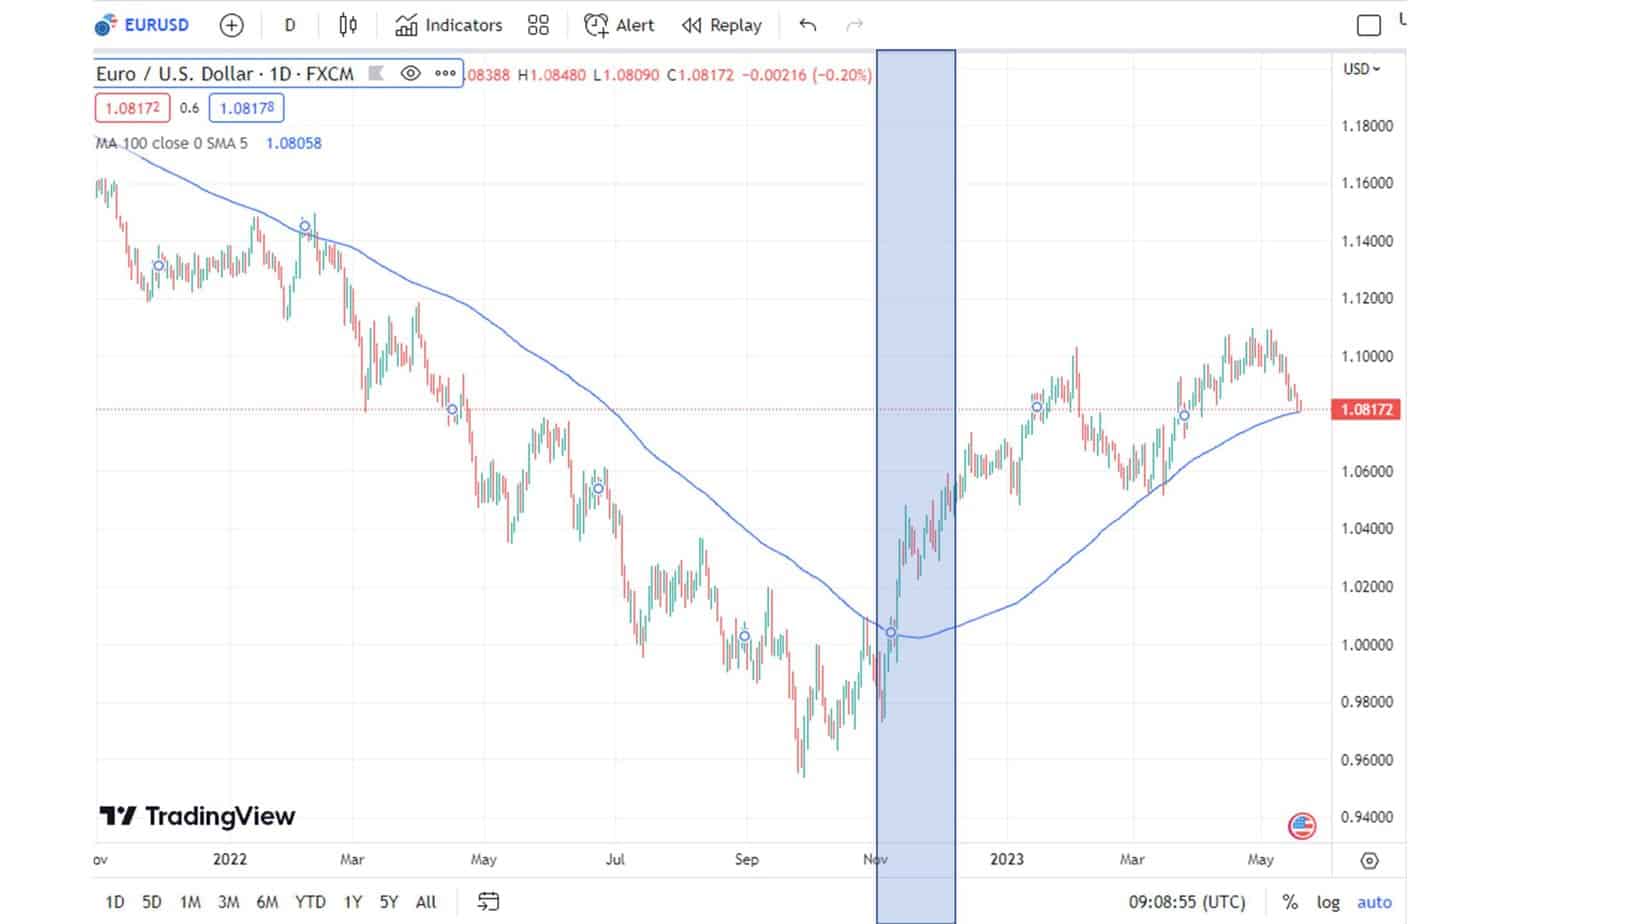
Now we can see EURUSD daily chart.
We will have it at the end of 2022. very very strong EUR, bullish trend reversal, and weak US dollar. In that case, BUY EURUSD:
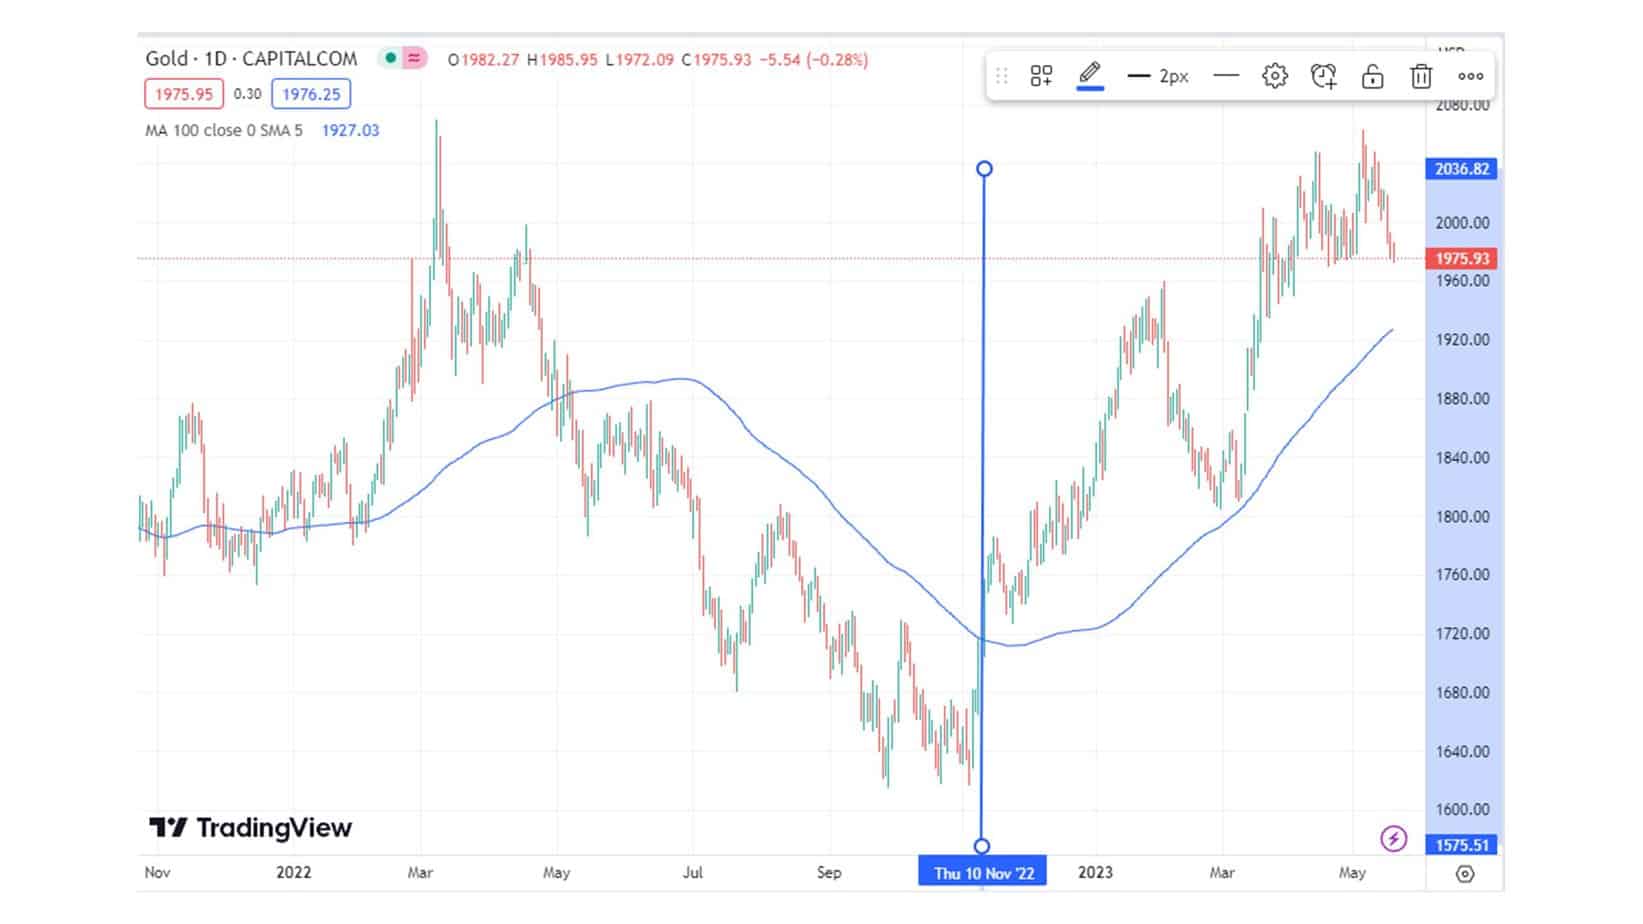
Gold COT Trading Strategy
In the context of the COT report for gold, “M Money” refers to the category that includes managed money or large speculators. These are typically hedge funds, commodity trading advisors (CTAs), and other institutional investors who engage in speculative trading.
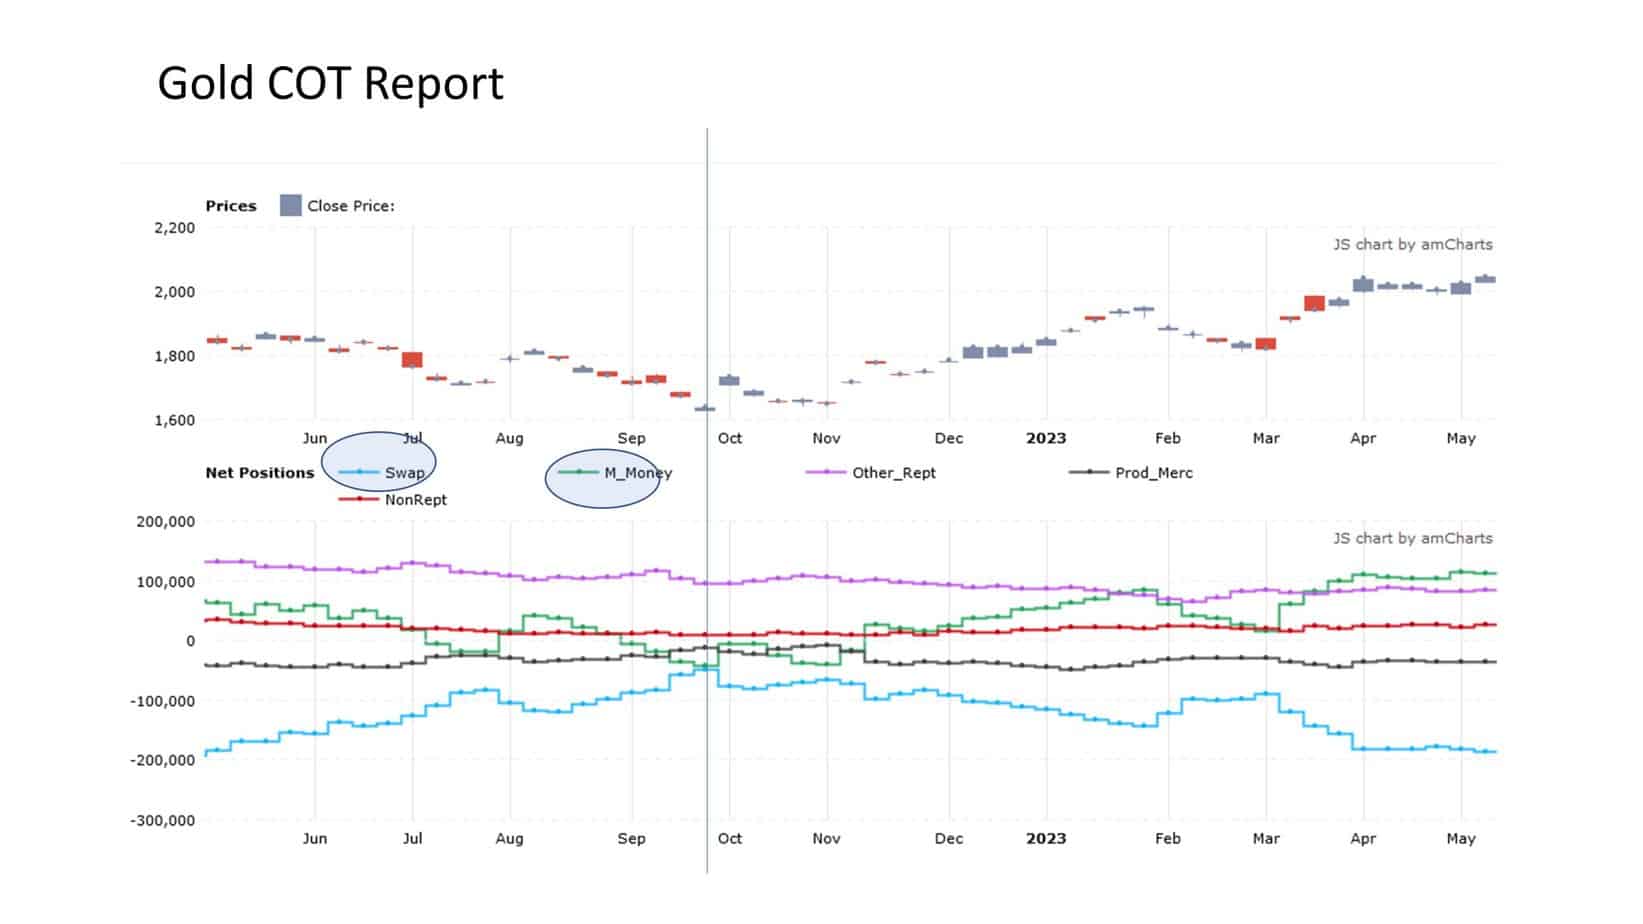
“Swap” refers to the category that includes the positions of swap dealers. Swap dealers are financial institutions that act as intermediaries in the derivatives market, facilitating transactions between different counterparties. They often use swaps to manage interest rates, currencies, or commodities risks.
In the COT report, the “M Money” and “Swap” categories provide insights into the positioning and sentiment of these specific types of market participants. Therefore, analyzing the positions and changes in these categories can help understand the behavior and potential impact of managed money and swap dealers on the gold market.
From October 2022. Gold is in a bullish trend. At the same time, the US dollar is in bearish mode. That means a solid bullish gold price trend from 1680 to 2036 in May.
Conclusion
The COT trading strategy is valuable for traders seeking to gain insights into market sentiment and potential trend reversals. By analyzing the positions of different market participants, mainly non-commercial and commercial traders, the COT report provides a snapshot of the prevailing sentiment and potential turning points in the market.
Combining the COT report for each separate currency, we can get excellent trading results using a weak/strong currency pair strategy.

He is an expert in financial niche, long-term trading, and weekly technical levels.
The primary field of Igor's research is the application of machine learning in algorithmic trading.
Education: Computer Engineering and Ph.D. in machine learning.
Igor regularly publishes trading-related videos on the Fxigor Youtube channel.
To contact Igor write on:
igor@forex.in.rs
Related posts:
- How to Read COT Report?
- Do I Need to Report K1 to Roth IRA?
- How to Trade Gold? – Learn Gold Trading
- The Best Divergence Trading Strategy
- Quality of Earnings Report! – QoE
- The Best Forex Trading Strategy that Work?
- Engulfing Trading Strategy – Case Study
- What is Order Block in Forex? – Order Block Trading Strategy
- Why Can’t I Trade Gold on MT4? – Add XAUUSD in MT4 & MT5 – Video!
- 200 EMA Stochastic Strategy – EMA 200 Strategy!
- Forex Weekly Strategy Based on 200 Moving Average
- What is ADX indicator? – ADX Trading Strategy
