Table of Contents
Most systems in trading are trend-following systems. But the market can be in a tight range over a long period.
So what is the sideways market?
A sideways market or a sideways drift occurs when the prices of investments remain in a tight price range for any period. They do not form many distinct trends for a significant time. The price action tends to be horizontal and doesn’t move above the previous highest price or fall below the last lowest drop. In such a market, neither the bulls nor the bears take charge.


So, let us see what is trading sideways in practice.
What does trading sideways mean?
Trading sideways represents the trading style when open positions are made within a reasonably stable price range without forming any bullish or bearish trends over some time. Usually, trading sideways presents trading in a tight price range.
While a sideways trend or drift can occur in any investment, like bonds, foreign exchange, and other commodities, it is often seen in the stock market, including the S&P 500, the Dow Jones Industrial Average, and the NASDAQ.
A sideways market is an economic phenomenon that occurs when the price of investment remains unchanged or moves within a tight trading range for a prolonged period. It can be seen as a sign of market indecision and reflects investor uncertainty. The price action in this type of market often appears horizontal, with neither the bulls nor the bears taking control.

Usually, after the sideway market (range market), we can see a strong bullish or solid bearish trend (see image below):
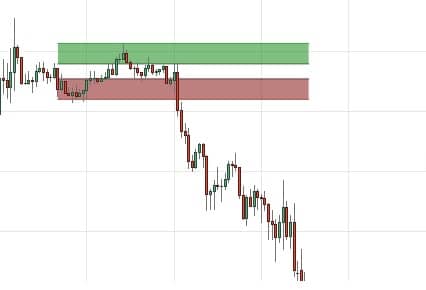
In traditional markets, prices tend to move in one direction over time, either up or down. When the trend is flat and prices remain static for a certain period, it’s considered a sideways market. This could refer to any security or index, including stocks, exchange-traded funds (ETFs), and commodities.
Sideway markets occur due to several factors, such as a lack of news catalysts or conflicting opinions among investors. For example, suppose investors are unsure about the future performance of a particular security or industry sector. In that case, they may hesitate to invest until they are more selective about its potential direction. Other possible causes include seasonal changes in demand or supply, low public interest in a specific asset class, and macroeconomic events such as trade wars and recessions that create market volatility.
Investors typically struggle to find opportunities during sideways markets since it’s difficult to identify positive trends that could lead to profitable trades. Traders can use technical analysis tools such as moving averages to identify potential entry points based on recent price activity. Additionally, some experts recommend focusing on specific assets during these periods because they may still offer trading opportunities despite overall market conditions.
The duration of sideways markets varies greatly depending on underlying economic factors and market sentiment at any given moment. While these periods can last anywhere from several days to several months – and even longer – they usually don’t persist for too long before the market makes some move upwards or downwards again.
Overall, understanding how different types of financial markets behave is essential for any investor looking to achieve success over time consistently. Sideways markets represent one type of condition that requires close monitoring and careful consideration before making any decisions so as not to be caught off guard by sudden shifts in pricing direction that could result in significant losses if not managed properly.
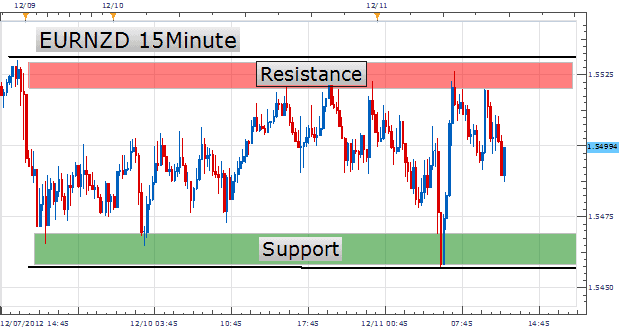
How to identify a sideways market?
The best way to identify a sideways market is to identify support and resistance levels. Support and resistance levels create a range where traders enter a position once the price drops to the support level and sell when the price rises to resistance levels. Thus, trading sideways implies buying assets at the support level and selling at the resistance level.
But how can we predict the future range market? I know it is almost impossible, but are there any signs that can help us?
How to predict a sideways market?
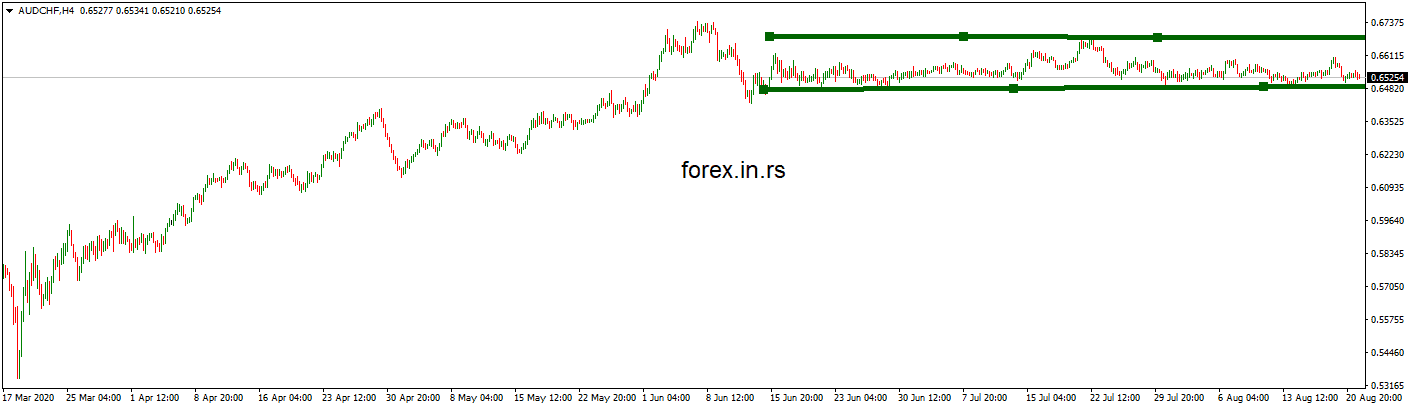
To predict the sideways market, traders need to identify volatility decrease using indicators (ATR, volatility, VIX, etc.) and defined price range using support and resistance. Usually, price oscillation in the range and a clear declining trend in volatility are early signs of a sideways formation. However, it is tough to create any prediction in financial and sideways markets.
For example, AUDCHF the whole summer of 2020. is in the tight range in the image below:
One of the primary things that a sideways market tells a trader is that the price trend will not see a sudden change. It will move horizontally or in the same direction as before. A sideways market is not the calm before the storm. A sideways market doesn’t occur before an immediate significant change or shift in the market.
Since the stocks are neither reversing nor reaching a more significant price, this situation is also called consolidation. During this period, the traders are unsure how the market will react once this stable period is over. Therefore, they build on their past gains with caution, waiting for the market to reverse its course. As time progresses without any change and the traders keep holding on, they gain confidence. Consolidation often happens when the market is about to go higher or lower than the previous highs and lows. The only exception is if it occurs during the transition of a business cycle. It then foretells the upcoming phase of the business cycle.
For example, during the business cycle’s peak, there might be a period of irrational movements. However, a sideways market may also occur before the market prepares to become bearish. Similarly, a recession, which often marks the bottom of a business cycle, can make a sideways market signal that the bulls control. Economic indicators can guide you during this time. They show the current phase of the business cycle.
Predicting a sideways market can be difficult for traders, as it requires the ability to identify subtle changes in the market before they become more evident. A sideways market is characterized by a price range that does not move significantly up or down and is often identified when volatility decreases and prices reach established to support and resistance levels. Although algorithms based on machine learning and simple regression models usually cannot predict a sideways market, traders should be aware of some warning signs that could indicate its formation.
One of the most reliable indicators that suggest a potential sideways market is decreased volatility. Volatility can be measured using various tools such as ATR, VIX, and other financial instruments. A decrease in volatility indicates that the price ranges have become narrower, suggesting that the market may be entering a period of range trading or consolidation. Traders should use this information to define their support and resistance levels better and set tighter stop-loss orders if they want to limit their risk exposure while trading during such periods.
Other signs of an impending sideways market are low-impact news events and low-volume trading activity. Usually, when the markets are volatile, high-impact news events can trigger significant price movements. In contrast, when markets enter into consolidation phases before forming a range trading pattern, news events have much less impact on prices because many traders tend to close their positions in anticipation of directionless trends until further clarity arises. Similarly, low-volume trading activity also serves as an indicator for sideways markets since there will be fewer large institutional investors looking to make big bets in either direction, which means more scalpers with more minor positions who will struggle to make meaningful moves in general until more clarity arises from certain news events or announcements from central banks or governments.
Although predicting sideway markets can be complex due to different factors influencing them at any given time, traders should always pay attention to warning signs like decreased volatility, low-impact news events, and low-volume trading activity – all three indicators can help traders understand how likely it is that markets may move into range bound patterns before taking positions or risk exposure in them. Additionally, it is also essential for traders to set tight stop-loss orders to minimize risk exposure if things do not go according to plan since range-bound markets tend to generate little profit opportunities but still carry significant risks due to sudden swings in prices under certain circumstances (for example when major news events occur).
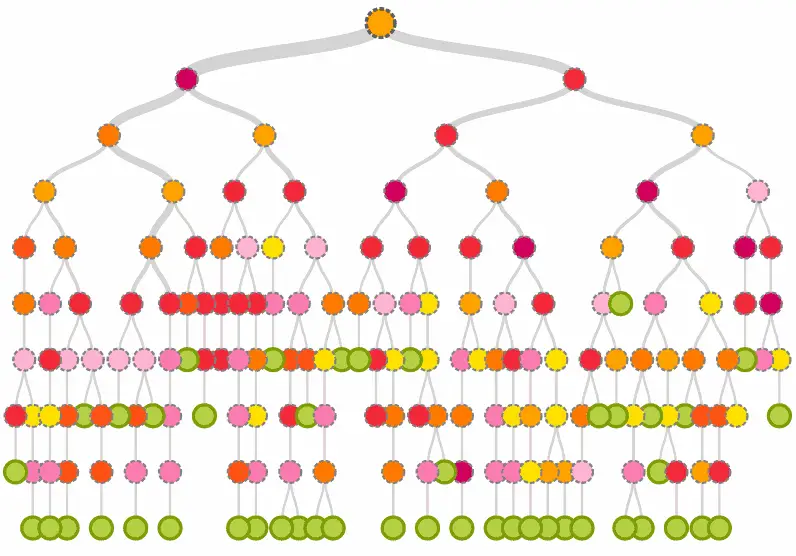
How to Predict a Sideways Market using ML?
Algorithms based on machine learning and simple regression models usually can not easily predict the sideways market. However, low volatility and low-impact trading news usually follow range markets. The market can be tight for a few hours, but it takes several months.
Creating many algorithms, several times I created Machine learning algorithms to predict sideways markets. Usually, using regression (decision tree regression), I made the classification. For example, if the market is sideways, it is 0, and if the market is in bullish/bearish mode 1.
A sideways market depends on two things, support and resistance. In a trading market, the buyers return when support is the price. They don’t let the prices fall below their comeback price. But, au contraire, the buyers sell their investments with resistance as they are confident they will go any higher. Thus, assessing support and resistance levels can easily predict whether they are dealing in a sideways market.
A sideways market is more neutral because it operates within support and resistance. This situation is referred to as a range-bound market. There may be occasional highs or lows, but the price movement neither crosses the highest high nor dips below the lowest low. In case it happens, that is the end of the sideways market. It, then, makes way for either a bull market or a bear market. The bulls take over when the prices exceed the resistance levels, and the bears take over when the prices fall below the support level.
How to Leverage the Sideways Market?
Since the price movement is horizontal in a sideways market, it offers fewer trading opportunities to day traders. It is a slow market and better suited for those planning to buy and hold. No trading market stays stable forever; the sideways market will also change. Before it happens, days traders are advised to diversify their investments. They might not gain much in this way, but they won’t lose too much.
Smart asset allocation is the key to leveraging a sideways market. Here, time becomes secondary. As a result, day traders need to rebalance their allocation in a sideways market.
For example, in January 2018, there was a beginning of a sideways trading pattern. On January 26, 2018, the Dow reached 26,616.71, which was a record closing high. After that, however, it ended up in correction territory and has been trading in a sideways range between 23,00 and 25,700 since then.
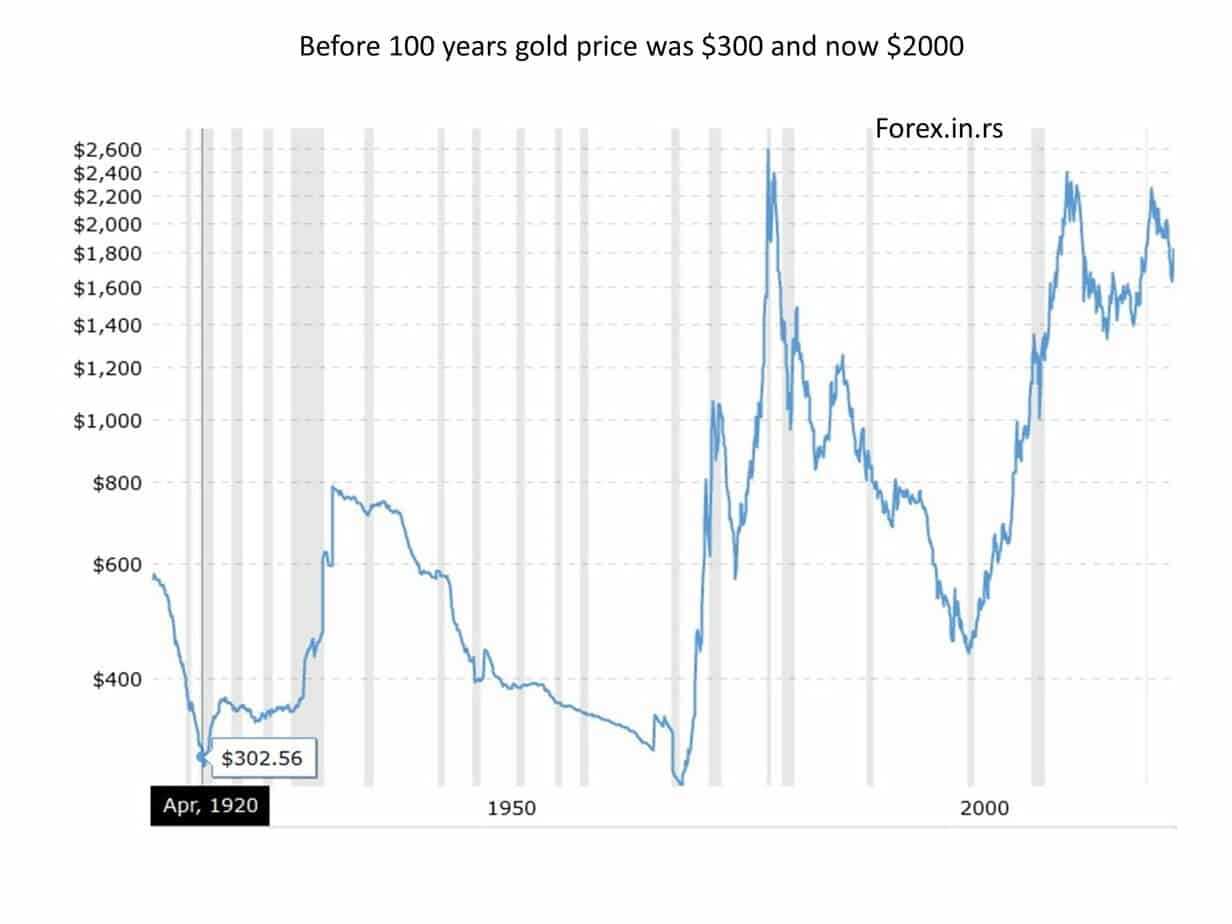
Another sideways market incident occurred when the business cycle’s contraction phase ended in 2011. The gold hit $1,895 an ounce. The fear of further contraction pushed investors to boost their prices. They wanted to avoid the Congressional threats of a potential debt default and a debt ceiling crisis. The commotion cost various traders a massive chunk of their investments when the bull market in gold ended, and the gold market traded sideways for most of 2012. The gold market often becomes bullish during crises. In 2013, gold prices entered a bear market because the economy was improving. The prices kept on falling in 2014.
In the middle of an expansion phase of the business cycle, the traders may switch from small-cap stocks to large-cap stocks. Here, consolidation occurs, which can also signify a sideways trend.

He is an expert in financial niche, long-term trading, and weekly technical levels.
The primary field of Igor's research is the application of machine learning in algorithmic trading.
Education: Computer Engineering and Ph.D. in machine learning.
Igor regularly publishes trading-related videos on the Fxigor Youtube channel.
To contact Igor write on:
igor@forex.in.rs
