Table of Contents
If you don’t know what these are, studies of Gann have been used by several traders for quite a lot of decades now. So even though stock markets and futures are rapidly changing, it is a well-known method to determine the direction of an asset.
For example, the latest trading areas, the market of foreign exchange, and the arrival of exchange-traded funds, a.k.a ETFs, are making sure an investor understands the application concepts and trading rules. Thus, although the ground-level rules of angles of Gann are still the same, you get a great level of knowledge about the reason behind changes in price levels in this article. You also get to know how volatility has made adjusting a few components essential.


What is Gann Theory?
Gann’s theory represents geometric technical analysis in trading based on Gann fan angles. Angles are mathematically calculated using the price, price range, time as inputs. Gann’s theory analyzes trading markets’ cyclical nature, and trader William Delbert Gann created it.
The angles working behind this theory are a trendy tool for trading and analysis, measuring important elements such as price, time, and pattern. A topic that’s always a talk amongst technical analysts – the point behind the past, present, and future, together are signified as one under an angle.
As one analyzes or trades the course under one specified market, the traders and analysts aim to set an ideology of its whereabouts, terms with the old top or bottom, and use the information to witness the future price action beforehand.

Trendlines vs. Gann Angles
Keeping all of the trading angles of Gann available aside, drawing the angles for trading along with forecasting is still one of the most used tools for analysis amongst traders. Several traders believe in drawing these on charts by themselves, and some even use packages of technical analysis that are computerized to view these on a screen. However, considering how easy it has become for traders of this era to put these angles on a chart, many traders do not consider the requirement to understand the how, why, and when would be the correct time to use them. Furthermore, these angles are compared with trendlines at certain times, whilst many people also know that these two aren’t the same.
An angle of Gann basically refers to a diagonal line moving across at a stable speed. Whereas trendlines are created with continuous connecting of bottoms with bottoms if there’s a situation of the uptrend and connecting tops with tops in case there is a downtrend. An advantage to going for an angle of Gann rather than a trendline is that the speed of movement is uniform. With this, analysts get the benefit of foreseeing the situation of the price on a respective date in the near time. Truly the Gann time analysis works fabulously and provides detailed insights to all the traders.
But, all of this information still doesn’t mean that the prediction of these angles will always identify the exact future of the market. Though, analysts will very well know the status of the angle of Gann, enforcing the right direction and strength towards the trend. At the same time, trendlines have a great value of prediction, which is often stripped off due to constant adjustments, and lack of trust in making forecasts for long terms.
Once stated above in this article, the major concept to keep in mind when you decide to work with angles of Gann is to know that the old, the present, and what’s ahead is present at the very same time on these angles. With this clearly understood, angles of Gann are great to be used for forecasting the strength, resistance, and support of both the timing of the bottoms & tops and understanding the direction.
Do Gann Angles Provide Resistance and Support?
Putting Gann’s angles to predict resistance and support is one of the most common ways to operate such angles. For example, after an analyst identifies the correct period of time to perform trading (daily, weekly, monthly) whilst particularly scaling these charts, a trader can easily draw three important angles: 2X1, 1X2, and 1X1, both the top section and bottom as well. With this technique, it is easier to frame a market, permitting analysts to view and go through the exact market movement with the Gann box indicator.
Angles that are trending up help attain support, whereas angles that are down-trending can provide greater resistance. As analysts are aware of the angle on the chart, it is easier for them to identify the right time for selling over resistance or buying over support.
Such a trader must even take note of the rotation of the market from one angle to another. Thus, the cycle is very recognized as the basic functioning rule amongst all angles. Also, it explains how if the market has to break a particular angle, moving towards the next one becomes crucial.
Also, another way to identify the resistance and support is to bring horizontal lines and angles together. For instance, down-trending can even lead to a retracement level by 50 percent under a Gann angle. Such a mix helps to stabilize an important point of resistance. With this, the section becomes a supporting key point. In the case of a chart that’s functioning for the long term, several angles coming along under a similar price will be clearly visible. Such sightings are known and considered price clusters. As the number of angles comes along, forming a cluster under one zone, the importance of resistance and support arises.
Gann 50 rule
Gann 50 rule shows that an asset will retrace 50% of its range in 50% of the time required to establish the range. So, for example, if EURUSD for 100 days went from 1.3 to 1.32, it would take 50 days to retrace to 1.31.
How to use Gann fan in forex?
Gann fan represents series of lines with angles. Angles help traders to define the direction of the trend and how the trend is strong. For example, if the price is trading above the 1:1 (45 degrees) angle, the trend is strong while below 45 degrees is weak.
The first and foremost angles of Gann are 1X1, 2X1, and 1X2. 1X1 explains the angle shifting one-time unit with one price unit. In the case of 2X1, angle shifts two-time units with one price unit. Lastly, the 1X2 signifies that angle shifts a single price unit with each of two-time units.
We can present angles with degrees too. For example, the most important Gann fan angles are 45 degrees (the most important), 82.5, 75, 71.25, 63.75, 26.25, 18.75, 15, and 7.5 degrees.
With the very same formulation, the angles also hold the potential of 1X4, 1X8, 8X1, and 4X1.
What is Gann square?
Gann square represents 9×9 grid spiral squares (spiral of numbers) where the initial number increases and moves in a spiral form and a clockwise direction. The idea is to calculate the square root from time and price and make a visual representation.
It is important to have a typical scale for this particular form of analysis. Gann aimed to establish a proper squared relationship; therefore, a scale and chart paper were two crucial materials to execute this technique. As the charts were square-shaped, often angles that are 1X1 are considered resembling 45 degree-angles. Hence to make one, you can take hold of these degrees, but only if the chart is well scaled.
Angles don’t just display resistance and support; these are also great in assisting analysts regarding the market strength. For example, with the Gann analysis forex, trading just on the spot or a bit upwards from a 1X1 angle that is up-trending signifies the right balance of the market.
On the stage where the market trades upon or a bit higher than an up-trending 2X1 angle, it signifies that the uptrend is strong. Whereas if someone trades over 1X2 or somewhere nearby, consider the market is not strongly holding up. When you look at the market’s condition from top to bottom, you’ll notice the strength moves under reverse once looked upon. In simpler terms, every angle coming under 1X1 displays the market’s weak situation.
How to use Gann Box?
Gann Boxes are drawn from Major Pivot Lows or Highs and represent the application of Gann squares. You can use them in trading to determine breakout positions. We created Gann Box – Gann Square strategy indicator, which determines breakout points.
Download Gann indicator MT4 and Gann box indicator
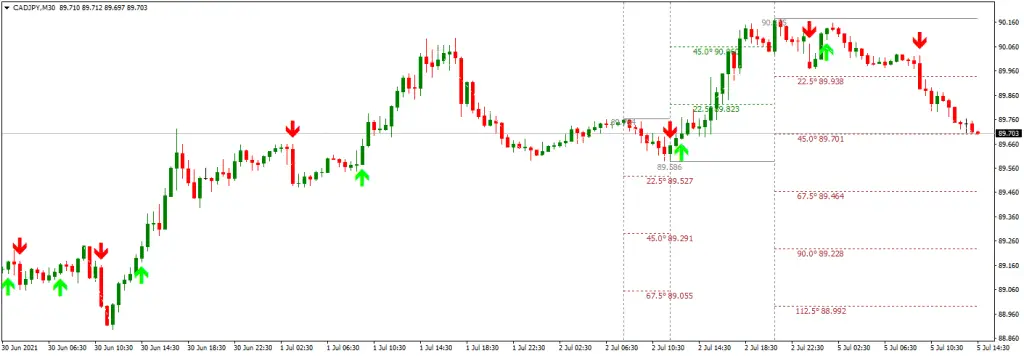
Download Gann square indicator Mt4 with Gann degree mt4 indicator (Gann box indicator on the chart)
Gann open breakout is a breakout arrow that shows when you can enter into trade. Using this indicator above, you can see on the chart Gann open breakout price levels.
What is Gann Square’s strategy?
The Gann square’s strategy implies using a 9×9 grid (spiral of numbers) to calculate square root from time and price and forecast future prices high or low. Gann theory and square root theory assume that the magnitude of asset volatility is directly related to its price.
Gann price and time trading
Using the indicator above, we can forecast breakout points and monitor Gann price and time trading. In addition, the Gann indicator calculates the square root from time and price and visualizes the MT4 chart.
It is easier to determine different time zones and the likeliness of the market to shift into directions with the mathematical technique of squaring. A simple point behind this is to witness directional changes every time the market reaches an equal time unit or ups and downs.
Daily charts feature quite a lot of ranges, shifting top to bottom for analysis; therefore, the timing indicators are seen working better on weekly and monthly charts. Just as the price action, time tools are visible, functioning better once brought together or clustered along with different time indicators.
Conclusion
If you’re thinking about using a Gann box, understand that angles of Gann are beneficial for traders only if operated correctly. With a fresh mindset, if you consider the old, the present, and the new, all present on an angle simultaneously, you will analyze the market every time, without fail accurately.
Getting the characteristics in your mind of the market considering volatility, scaling of prices, and movement of the market under the framework of angles of Gann will help bolster up your skills in terms of analytics.

He is an expert in financial niche, long-term trading, and weekly technical levels.
The primary field of Igor's research is the application of machine learning in algorithmic trading.
Education: Computer Engineering and Ph.D. in machine learning.
Igor regularly publishes trading-related videos on the Fxigor Youtube channel.
To contact Igor write on:
igor@forex.in.rs
Related posts:
- What is Gann Square of 9 in Trading? – How to Trade with Gann Method
- Download MT4 Price Display Indicator – Show Pips MT4
- Where is Fibonacci Indicator in HF Markets Platform?
- Forex Day Trading Best Indicators – Case Study
- Price Action Trading System
- Download Auto Support Resistance Indicator
- Download Price Action Pattern Indicator MT4
- Download Swing ZZ MT4 indicator
- What is Pivot Point Trading?
- Download Auto Trend Channel Indicator MT4
- Download Buy Sell Magic Indicator MT4
- How to Read VWAP?
