Table of Contents
Most traders in Forex exchange (Forex) are unfamiliar with Forex market geometry since there are no specific rules for defining it. It is mainly based on using earlier prior market data for predicting future trends. It is similar to the Elliott Waves theory, which also uses earlier patterns for future prediction. However, Elliott’s approach is based on corrective, impulsive waves, and the rules are clearly defined. Market geometry can only be used with ranging or consolidating markets, having corrective waves, and estimating predictions.
What is forex market geometry?
Forex market geometry represents a procedure where the traders analyze geometric shapes, from lines to angles, patterns, waves, and the distance between price levels to predict the trend, find the best setup to exist, or enter the trade. The most commonly used method is Elliott’s theory which analyzes waves.


Calculating Market Geometry using Ranges


For calculating market geometry, a range is first required. For this, some consolidation of earlier data will be required. After this, the swings around a particular point in the chart will be monitored to make Forex trading decisions like selling and purchasing Forex. The EUR/USD currency pair is widely used in Forex trading, and the daily Forex chart can be used for understanding the principles.
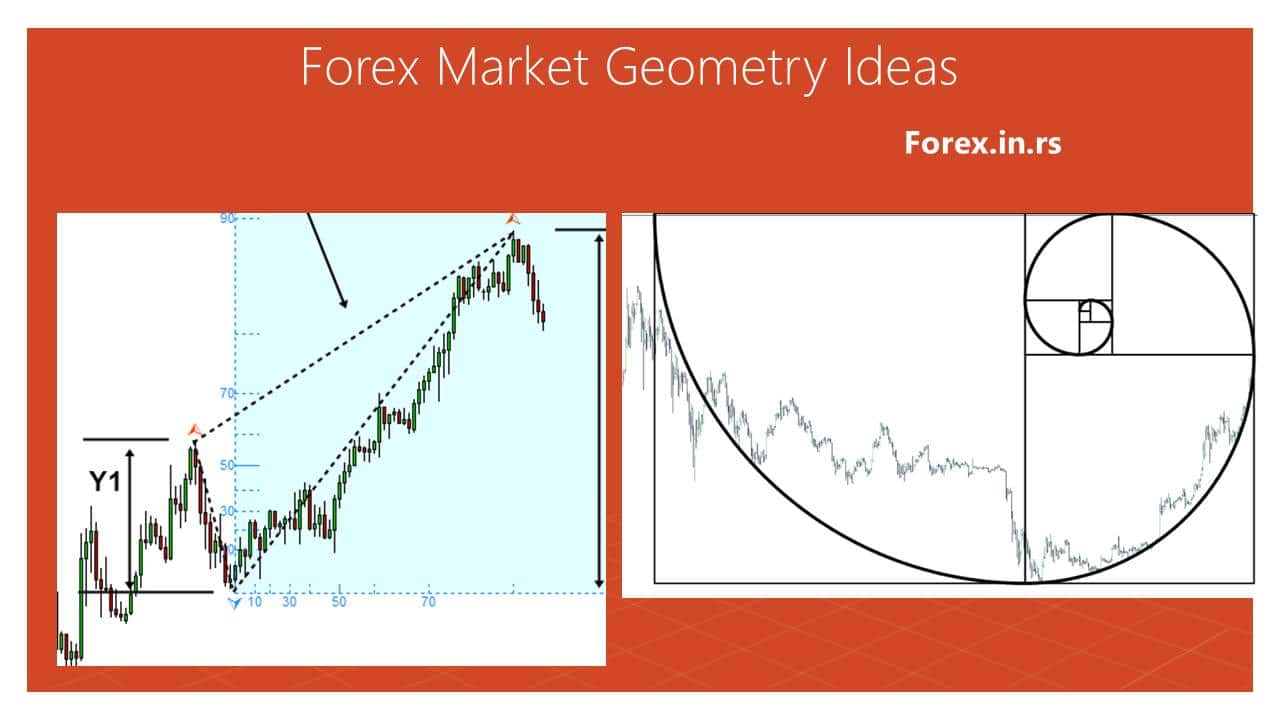
Forex market geometry is a foreign exchange market trading method that uses geometric shapes, patterns, and measurements to analyze and predict market behavior. This trading approach is a technical analysis that employs mathematics, geometry, and visual arts to identify profitable trading opportunities. It transcends the boundaries of traditional technical analysis, which typically focuses on price movements, patterns, and trends. Market geometry includes techniques like drawing trend lines, Fibonacci retracement levels, Gann lines, channels, and others to study the market.
Market geometry is based on the principle that the forex market moves in repetitive cycles like any other market. These cycles often form specific shapes and patterns, which, if correctly interpreted, can provide insight into future market movements.
Elliott Wave Theory
The Elliott Wave Theory, formulated by Ralph Nelson Elliott in the late 1920s, is a prominent concept in forex market geometry. Elliott suggested that market prices move in specific and predictable patterns, known as waves. The theory postulates that market price movements can be predicted by identifying a pattern of five progressive waves followed by three regressive waves.

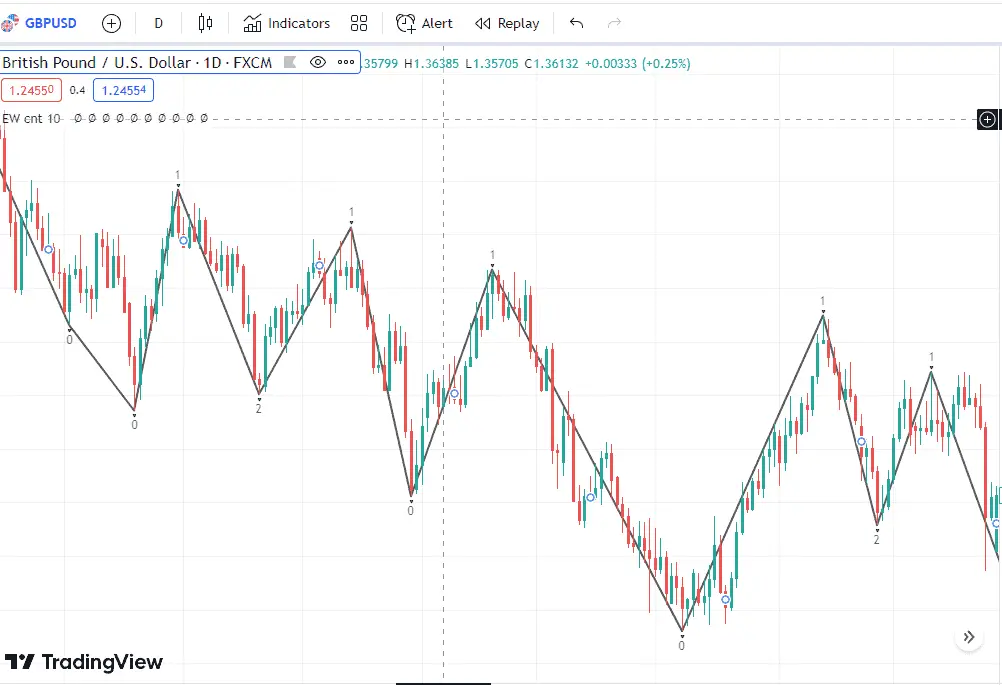
These wave patterns are divided into impulsive and corrective waves. Impulsive waves, numbering five, indicate the direction of the market trend. In contrast, corrective waves, which are three, go against the market trend. Elliott’s model determines entry points, exit points, and where to place stop losses.
Fibonacci Retracement
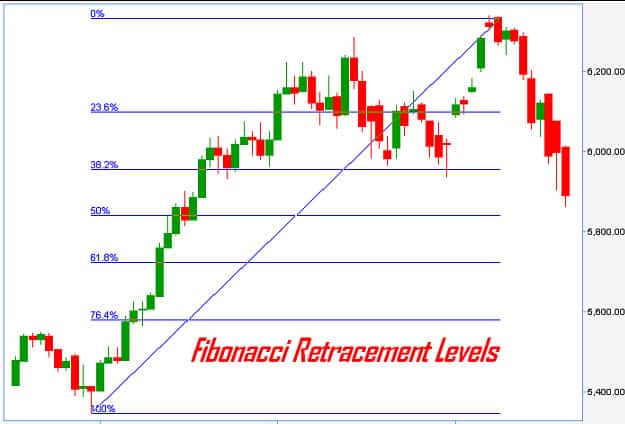
Fibonacci retracement is another vital tool in forex market geometry. It uses horizontal lines to denote areas of support or resistance at the key Fibonacci levels before the price continues in the original direction. The mathematical relationships within the sequence of Fibonacci numbers determine these levels. Traders use these levels as potential entry points, stop loss levels, or target prices.
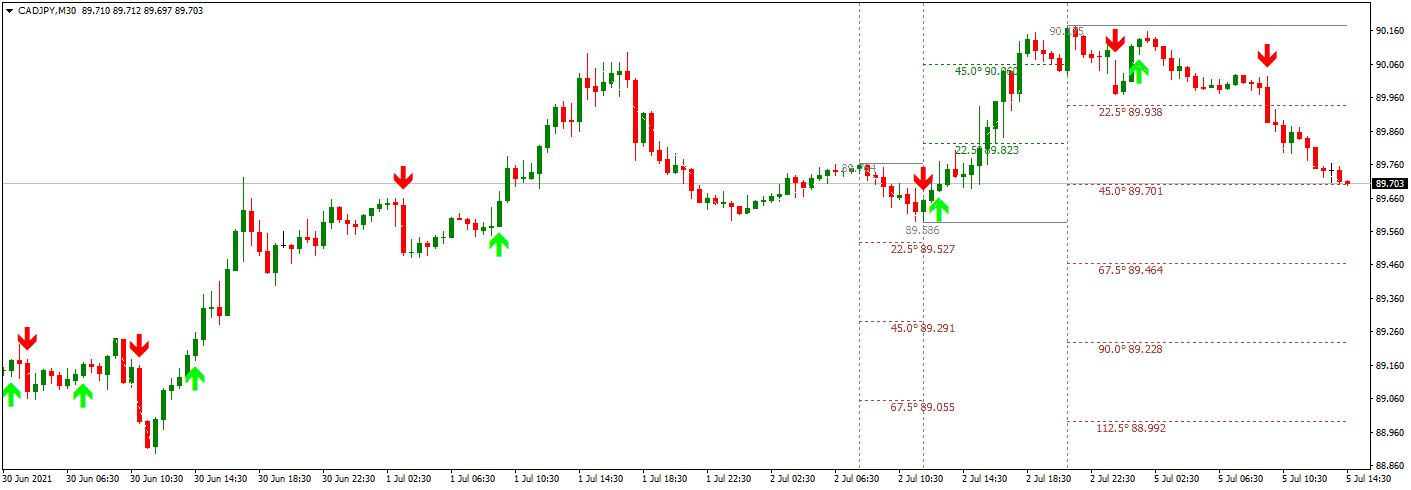
Gann Angles
Named after its developer, William Delbert Gann, Gann angles is a tool in forex market geometry used to calculate the expected price movement rates. The Gann theory postulates that prices move in a 1:1 relationship to time. This is known as the 45-degree angle, and according to Gann, it represents a long-term trend line. The Gann Angles, combined with other forms of technical analysis, can offer unique insights into future price movements.
Channels and Trend Lines
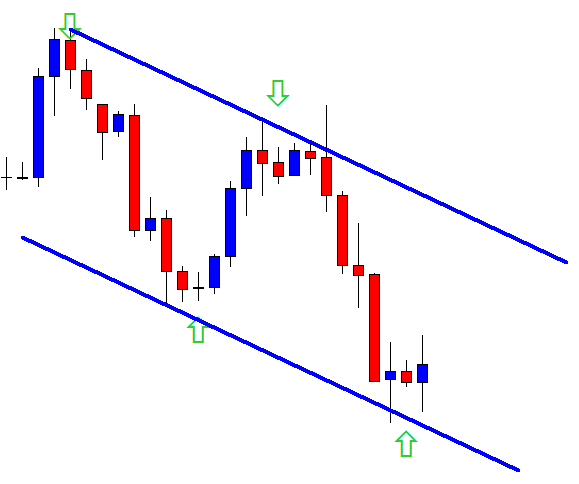
Drawing channels and trend lines is a fundamental approach to forex market geometry. The trend line is drawn over pivot highs or under pivot lows to represent the prevailing market direction. The channels are two parallel trend lines with prices moving between them. The top line is drawn over pivot highs and the bottom line under pivot lows. Trend lines and channels act as potential support and resistance levels.
Calculate price projection using market geometry.
For market geometry analysis, a starting point should be chosen: the initial part of the consolidation area. Usually, it is a point where the price stabilizes after a steep drop. Then a horizontal line should be drawn, passing through the starting point. This line is used for making decisions after analysis of the market geometry. The amplitude of the lowest or highest point is measured when compared to the starting point’s value. The point furthest from the starting point is the amplitude for further analysis.
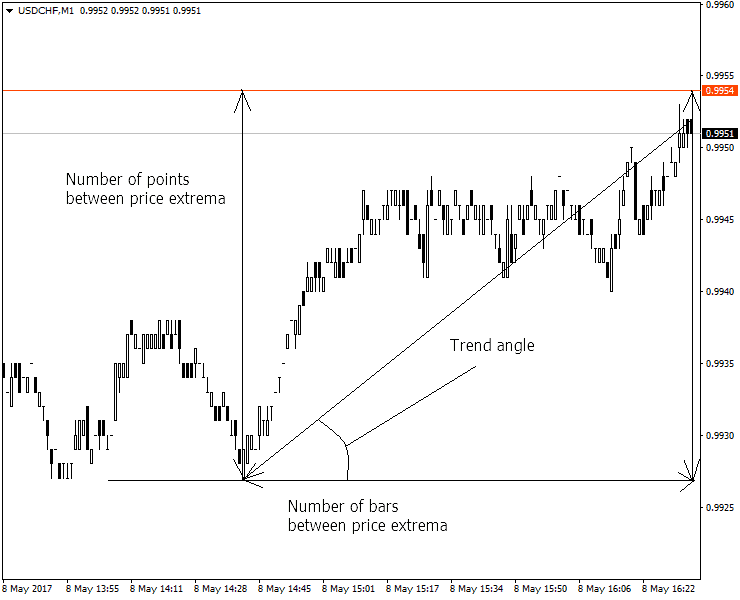
Make price projections
The amplitude of the market geometry can help decide when the opposite swing will take place and how it will look. Usually, after some time, the market returns to the same levels as the starting point. After this, it is possible to define the inner levels for determining the entire range and trading in the future. Pricing-related decisions should be taken only after confirming the amplitude. It is also possible to set up the market geometry using the amplitude information, confirmed following the guidelines listed below.
The amplitude spike distance can protect it from the starting point and divide the channel into different parts based on its value. If the price falls on the upper half of this channel, there is a bearish bias since the market will be attracted to the pivot level. On the other hand, if the price falls into the lower price range in the channel, the market bias is bullish.
The Fibonacci retracement tool can be used to find the 61.8%, 50%, and 38.2% levels for each channel. Depending on the price, these points become the entry points for short and long trades. When the price is at the upper half of the channel, geometry trading recommends that the trader shorts at these levels. He should take profit when prices reach the pivotal level. Conversely, when prices are on the lower side channel, the trader should buy at Fibonacci levels and profit at the defined pivotal level.
See one of the practical examples of how to draw lines and make a chart geometry analysis video:
Though this approach appears simple, it is incredibly profitable for the Forex trader since the Forex market is still following the same pattern. The stop loss should be defined at the top and bottom of the range to complete the market geometry setup. While the risk-to-reward ratio is not very impressive, the trader can be highly profitable if the range remains unchanged. At some point, the market range will be broken, and the pricing will hit the stop loss, yet the trader has already made so much profit that the loss is not significant.
Conclusion
Overall profits are the main goal while trading in the Forex and other financial markets. Most traders find it difficult, and it is usually challenging to implement market geometry. The trader should take a long-term view; to remain profitable, one trade is irrelevant in the long term. Traders who will make profits from winning trades will also lose money, yet the account amount should increase. It is essential to understand the psychology of the market and how it affects the trader’s profit. Market geometry helps to ensure that the trader is disciplined and focuses on technical matters.
However, like any other trading approach, market geometry is not foolproof. While it can provide an added advantage, it doesn’t guarantee success. Traders should use it with other trading tools and strategies to improve their accuracy and success rate. Moreover, a good understanding of forex market fundamentals is necessary to use market geometry effectively.

He is an expert in financial niche, long-term trading, and weekly technical levels.
The primary field of Igor's research is the application of machine learning in algorithmic trading.
Education: Computer Engineering and Ph.D. in machine learning.
Igor regularly publishes trading-related videos on the Fxigor Youtube channel.
To contact Igor write on:
igor@forex.in.rs
