Table of Contents
Bloomberg Terminal has been a popular investment platform for many years now. But traders might be on the lookout for something new. There are good reasons to search for a Bloomberg substitute. A seat at the Bloomberg Terminal might cost upwards of $20,000 to $25,000 annually. That has a lot of traders looking for something new on the market. Fortunately, there are great options that people can choose from going forward. The proper Bloomberg substitute is a matter of much debate among traders today. They have some excellent options, which will also be made clear.
We know that Bloomberg is a famous financial news TV channel, but its platform is an excellent solution for real traders and investors.


Do not forget to read our article How to Access the Bloomberg Terminal For Free if you are a student.


What is the best free alternative to the Bloomberg terminal?
Koyfin is the best free alternative for small traders to the Bloomberg terminal because it offers similar fundamental and technical analysis for thousands of equities. TradingView is the best free chat platform, while TrendSpider is the best price analysis software.
If you are an individual trader or small organization and you need terminal software for charting and basic analysis, there are free alternatives.
However, the Bloomberg terminal does not have an alternative for institutional traders. The Bloomberg Terminal remains unparalleled primarily due to its comprehensive integration of real-time data, analysis tools, and trading capabilities, which are essential for high-level financial decision-making.

Its vast network effects are cemented by a critical mass of industry professionals on the platform, making it a central hub for financial communications and transactions. The terminal offers exclusive access to specific market data and analytics unavailable through other platforms, giving users a competitive edge.
Bloomberg’s continual investment in technology and infrastructure ensures that it stays at the forefront of financial data services, further entrenching its market position. The high cost of the terminal, while a barrier for some, signifies its value and exclusivity, reinforcing its status as a must-have tool for major financial institutions. Lastly, the customer support and customized training Bloomberg provides is unmatched, enhancing user reliance on the platform for diverse financial operations and strategic insights.
Koyfin is an excellent free Bloomberg Terminal alternative, offering robust fundamental and technical analysis for many equities. It visualizes financial data in a user-friendly dashboard format and offers insightful economic data. TradingView is widely regarded as the best free charting software platform, presenting a suite of advanced charting tools, a broad market coverage, and a unique social trading community.
Meanwhile, TrendSpider is a leading price analysis software, providing automated technical analysis, backtesting capabilities, and customizable price alerts. However, the choice between these platforms depends on the user’s specific needs and trading style, with Koyfin excelling in fundamental analysis, TradingView in charting and community engagement, and TrendSpider in automated technical analysis and strategy refinement.
Koyfin is the best free alternative to Bloomberg Terminal
Koyfin is a data visualization and investment research platform that provides users access to various financial data, news, and analysis. The platform is designed to be easy to use and navigate, and it offers a variety of features that can help users make informed investment decisions.
See the screenshot of the main dashboard that is very similar to the Blomberg terminal:
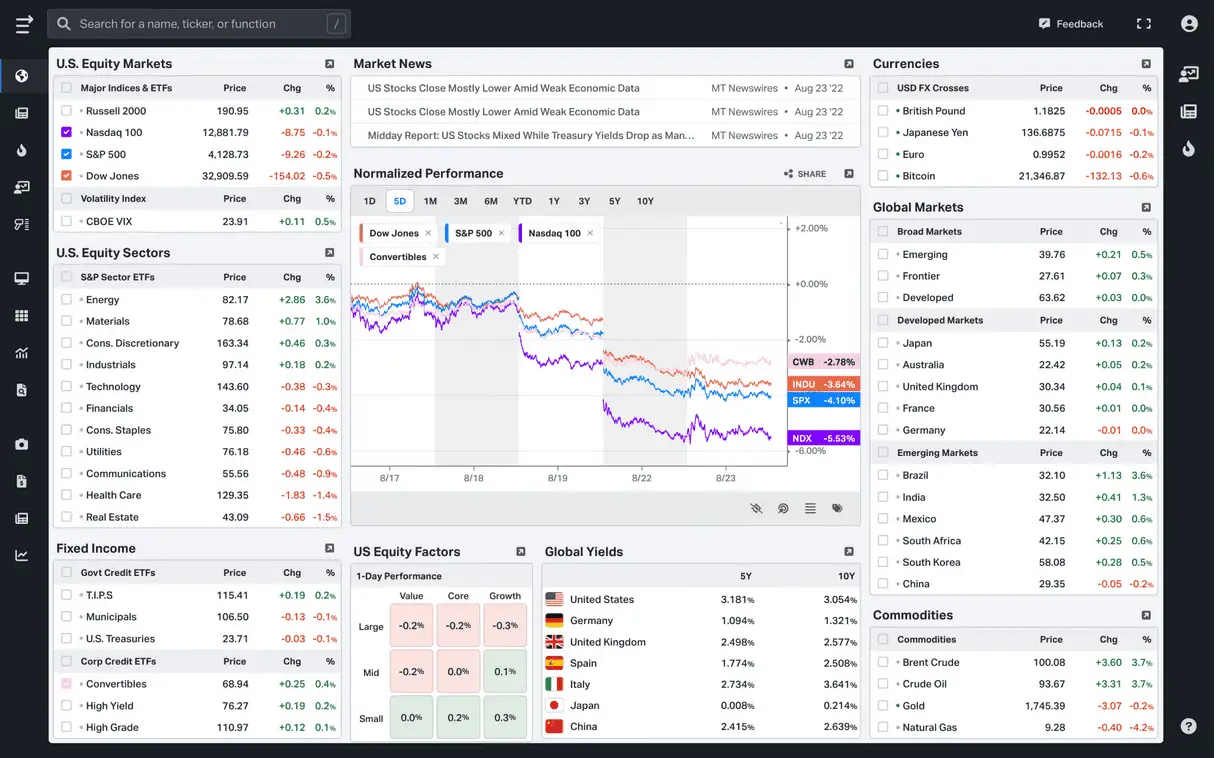
In the free version, Koyfin offered an impressive suite of tools for no cost. The platform provided in-depth stock analysis, including technical analysis charts, fundamental data, and news aggregation. It was a valuable resource for investors needing a comprehensive market view without a budget for high-cost tools.
The $35 per month version offered additional functionalities for those needing more features. Beyond the basics, users could access more advanced analysis tools and features such as portfolio analysis, alerts, and expanded data sets. These additional features made this version suitable for more severe investors and financial advisors who wanted to stay on top of their investments and the market.
The Pro version, priced at $70 per month, offered the highest functionality and data access level. Designed with professional investors and analysts in mind, it offered all the tools and features of the other versions, plus more sophisticated analytics, the ability to export data, priority customer support, and more. It provided a level of detail and customization that made it worth considering for individuals who rely heavily on market data and sophisticated analysis.
Some of the advantages of using Koyfin include:
- Access to a wide range of data: Koyfin provides users with access to a wide range of financial data, including stock prices, bond yields, currency exchange rates, and historical data. This data can be used to track the markets, conduct research, and make informed investment decisions.
- Data visualization: Koyfin offers a variety of data visualization tools that can help users to make sense of the data. These tools can create charts, graphs, and other visuals to help users understand market trends.
- News and analysis: Koyfin also provides users access to news and analysis from various sources. This can help users to stay up-to-date on the latest market developments and to learn about different investment strategies.
- Easy to use: Koyfin is designed to be easy to use and navigate. The platform has a user-friendly interface that makes it easy to find the data and tools you need.
Here are some of the features of Koyfin:
- Market data: Koyfin provides access to real-time and historical market data for stocks, bonds, currencies, and other assets.
- News and analysis: Koyfin provides access to news and analysis from various sources, including Bloomberg, Reuters, and The Wall Street Journal.
- Data visualization: Koyfin offers a variety of data visualization tools for creating charts, graphs, and other visuals that can help users understand the data.
- Investment research: Koyfin provides users access to various investment research tools, such as screeners, backtesting, and portfolio analysis.
- Social media integration: Koyfin integrates with social media platforms, such as Twitter and LinkedIn, so that users can share their research and analysis with others.
TradingView Free Chart Software
While Bloomberg Terminal has long been the industry standard for financial professionals, it comes with a substantial cost, making it inaccessible for many retail traders and investors. Enter TradingView is a web-based charting platform that has gained immense popularity for its advanced features, user-friendly interface, and, most importantly, being free (with optional premium features). Here, we’ll explore why TradingView is the best free chat platform and a solid alternative to Bloomberg Terminal (specifically for charts).
- User Interface and Accessibility: TradingView’s user interface is clean, intuitive, and easy to navigate, making it accessible for seasoned traders and beginners. The platform’s web-based nature means there’s no need to download or install any software, making it incredibly convenient to access charts from any device with an internet connection. In contrast, Bloomberg Terminal often requires dedicated hardware and software installations, making it less accessible and user-friendly, especially for traders on the go.
- Charting Tools and Customization: TradingView’s charting capabilities are extensive and versatile. It offers various technical indicators, drawing tools, and chart types. Users can customize their charts to suit their preferences and trading strategies. Whether you’re a day trader analyzing minute-to-minute price movements or a long-term investor studying weekly or monthly charts, TradingView has you covered. Bloomberg Terminal does offer powerful charting tools, but it may be overwhelming for those primarily interested in charts, as it comes bundled with a vast array of other features and data.
- Community and Social Interaction: One of TradingView’s unique strengths is its community aspect. Users can share their chart analyses, ideas, and strategies with the broader TradingView community. This fosters a collaborative environment where traders can learn from each other and gain valuable insights. The ability to interact with other traders and follow their charts adds a social dimension to the platform, which is lacking in Bloomberg Terminal.
- Integration with Brokerage Accounts: TradingView integrates with various brokerage accounts, allowing users to execute trades directly from the charts. This feature streamlines the trading process, eliminating the need to switch between platforms. While Bloomberg Terminal also supports trading functionality, it may not be as seamless as TradingView’s integration with specific brokers.
- Cost-Effectiveness: TradingView’s most significant advantage over Bloomberg Terminal is its cost. TradingView offers a substantial portion of its features for free, making it an attractive option for traders on a budget or those who don’t need the extensive data and analytics offered by Bloomberg Terminal. While TradingView does offer premium subscription plans with additional features, many users find the free version sufficient for their charting needs.
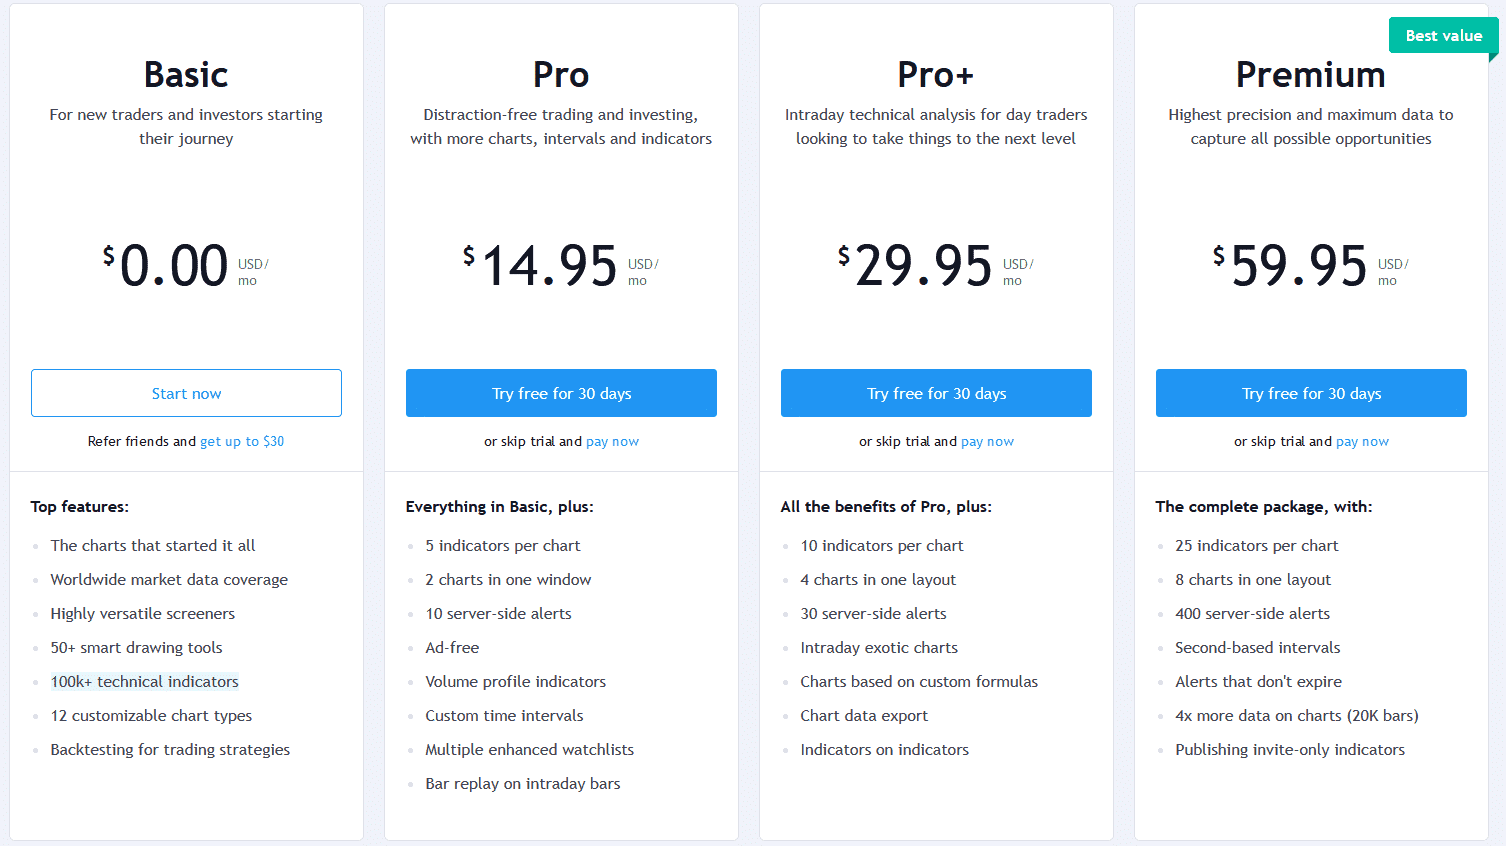
TradingView except for free version offers and pro package:
TradingView vs. Bloomberg Terminal
TradingView and the Bloomberg Terminal are two significant platforms regarding financial analysis and trading. However, each platform has unique features, tools, and capabilities that suit certain users best. Here is a comparison of TradingView and the Bloomberg Terminal:
1. Accessibility
- TradingView: TradingView operates as a web-based platform, meaning that it’s accessible from any device with an internet connection. Regardless of the operating system, you can use it from your smartphone, tablet, or computer.
- Bloomberg Terminal: The Bloomberg Terminal requires specialized hardware and software, which limits its accessibility. It’s primarily used on dedicated systems provided by Bloomberg. It does have a web-access version, but it isn’t as comprehensive as the Terminal version.
2. Cost
- TradingView: TradingView is much more affordable than the Bloomberg Terminal. It offers a range of plans, including a free version with limited functionality and premium plans that start from $14.95/month and can go up to $59.95/month as of my last update in September 2021.
- Bloomberg Terminal: The Bloomberg Terminal is expensive. As of 2021, a single Terminal subscription costs $20,000 annually. The high cost often restricts its use to professional traders and financial institutions.
3. Data Coverage
- TradingView: TradingView provides comprehensive market data, including stocks, cryptocurrencies, futures, indexes, Forex, and CFDs. However, its coverage of fundamentals and global macro data may not be as in-depth as that of the Bloomberg Terminal.
- Bloomberg Terminal: The Bloomberg Terminal is renowned for its extensive data coverage. It offers a deep dive into fundamentals, fixed income, commodities, derivatives, and global macro data, making it ideal for complex financial analysis and modeling.
4. Tools and Features
- TradingView: TradingView is best known for its charting tools and social trading features. Users can create and share trading ideas and strategies, follow other traders, and collaborate. It’s user-friendly and has a scripting language called Pine Script for users to develop indicators.
- Bloomberg Terminal: The Bloomberg Terminal offers advanced analytical tools, trading systems, and in-depth news and research. Its tools are more advanced, including risk analysis, portfolio management tools, and more.
5. User Base
- TradingView: TradingView is popular among individual traders and investors, given its affordability and ease of use. It’s great for beginners and intermediate-level traders looking for charting solid tools and a social trading environment.
- Bloomberg Terminal: The Bloomberg Terminal is more prevalent among professional traders, financial analysts, and large institutions. It’s designed for those needing advanced trading and complex financial analysis.
TradingView is an excellent choice for individual retail traders and investors who need advanced charting capabilities and enjoy community engagement. On the other hand, Bloomberg Terminal is a comprehensive solution for financial professionals, offering an extensive suite of data, analytics, and communication tools. Still, its high cost restricts access to institutional and larger-scale users.
While Bloomberg Terminal remains a preferred choice for professionals requiring a vast range of financial data and analytics beyond just charts, TradingView undoubtedly shines as the go-to charting platform for traders seeking a free and accessible solution.
Trendspider Best Price Analysis Platform
TrendSpider is a modern, robust trading platform that has carved out a unique space in price analysis. As an innovative tool designed to automate technical analysis, TrendSpider has proven to be a godsend for traders keen on saving time and increasing precision in their trading decisions.
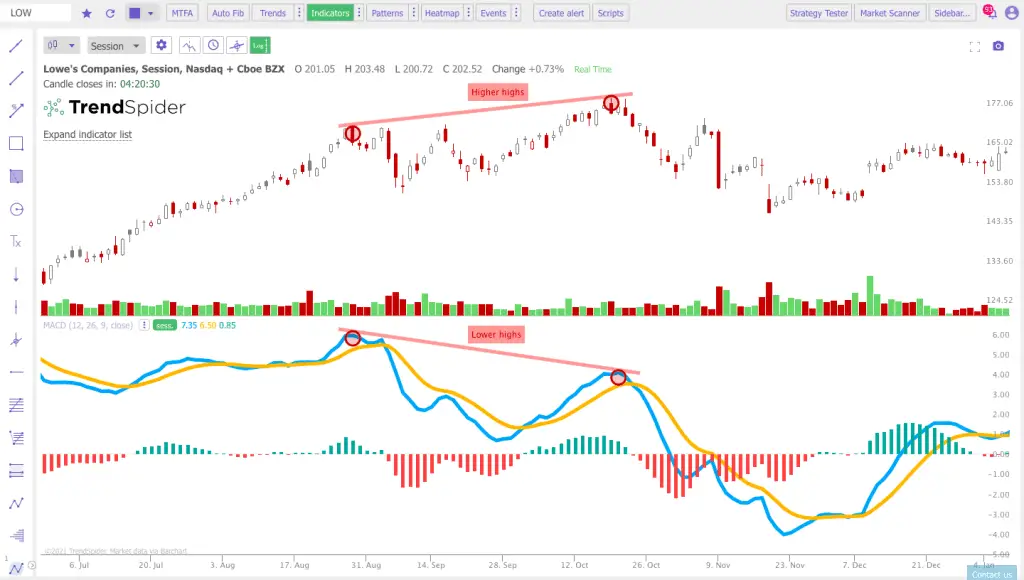
Key Features
- Automated Technical Analysis: TrendSpider’s most striking feature is its automated technical analysis. This platform uses algorithms to automatically identify common technical patterns and trends, removing subjectivity and potential human error from the process. This automation is a game changer for traders accustomed to manual charting.
- Dynamic Price Alerts: This feature allows you to set alerts based on many conditions, including price levels, trendline intersections, and indicator thresholds. These alerts are highly customizable and can even be set to factor in the closing prices of candles.
- Multi-Timeframe Analysis: TrendSpider has an excellent feature that allows users to view multiple timeframes on a single chart. This ability to visualize and analyze trends across different timeframes can be highly beneficial for identifying more prominent market trends.
- Raindrop Charts: A proprietary visualization tool that blends the benefits of line, bar, and candlestick charts, Raindrop Charts offer another level of depth to price analysis. They uniquely enable traders to assess volume flow and price levels, providing a potential edge.
- Market Scanner: The Market Scanner is an efficient tool that can scan a wide range of assets based on custom criteria, saving traders significant time to identify trading opportunities.
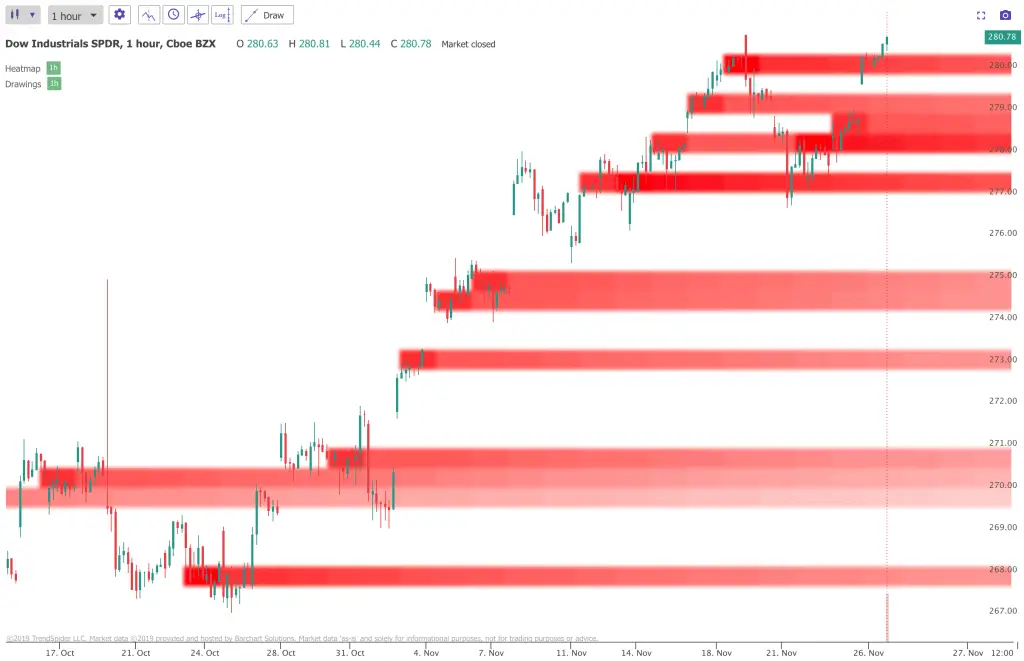
See, for example, from my dashboard, how it looks like the TrendSpider heatmap screenshot:
TrendSpider Advantages
- Fast and Reliable Performance: TrendSpider is designed to handle large amounts of data quickly and reliably, making it suitable for professional traders and businesses.
- Advanced Charting Capabilities: The platform offers advanced charting tools, allowing users to visualize and analyze market data effectively.
- Customizable Analysis Rules: TrendSpider allows users to modify analysis rules to align with their trading strategies, enhancing the platform’s flexibility.
- Innovative and Personalized Watchlist: Users can create a personalized watchlist so they never miss a trade opportunity.
- Different Graphic Styles and Layouts: The platform provides multiple graphic styles and layouts, allowing for a tailored user interface.
- Real-time Alerts: TrendSpider enables users to set up real-time alerts that can be connected through email and text messages, keeping users informed of significant market movements.
- Adaptable Graphs: Users can customize and manipulate graphs to suit their preferences and analysis needs.
- Multi-Timeframe Data View: TrendSpider supports the ability to view data across multiple time scales, enhancing market trend analysis.
- Technical Analysis: The platform identifies trend lines, resistance, support levels, and technical patterns, making it a comprehensive tool for technical analysis.
- Cross-Timeframe Candlestick Patterns: It can recognize candlestick patterns across different timeframes, providing a holistic market view.
- Indicator Values: TrendSpider can calculate and display the values of numerous technical indicators.
- Automatic Drawing of Trendlines: The platform can automatically draw trendlines, eliminating manual work.
- Trend Line Analysis: Users can conduct in-depth trend line analysis with the help of automatically drawn trendlines.
- Candlestick Pattern Identification: TrendSpider can automatically identify and highlight various candlestick patterns.
- Automatic Calculation of Fibonacci Levels: The platform can automatically compute and display Fibonacci retracement levels, aiding users in predicting future price movements.
- Over 40 Candlestick Patterns Detected: TrendSpider can mathematically detect and highlight over 40 different candlestick patterns, helping traders identify potential trading signals.
TrendSpider’s primary strength lies in its capability to streamline and automate technical analysis. This feature saves time and ensures more accuracy, allowing traders to focus more on strategy and less on the manual aspects of analysis. Moreover, the platform’s innovative tools, like Raindrop Charts and Dynamic Alerts, and features like multi-timeframe analysis offer unique angles to the study of price action.
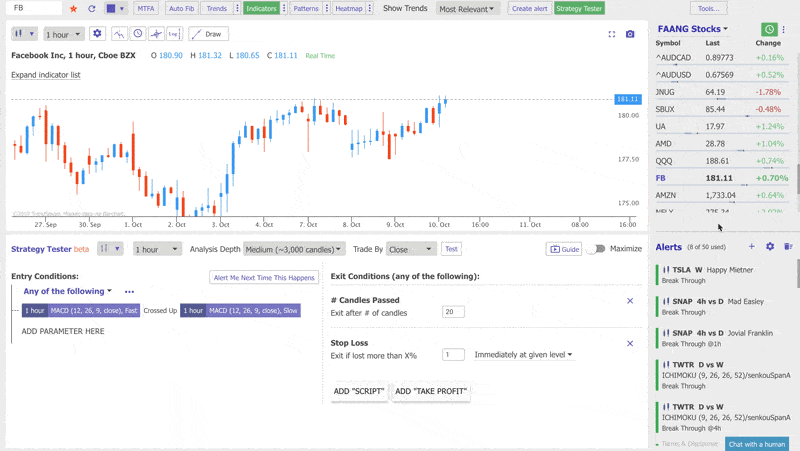
See, for example, the Trenspider prediction tool:
TrendSpider is a strong contender for an advanced, automated technical analysis platform. Its unique features provide traders with innovative ways to analyze price action, giving them a potential edge in the market. However, it may be less suitable for beginners or those looking for broker integration. Despite these minor drawbacks, TrendSpider remains a pioneering force in automated price analysis.
Best Paid Alternative to Bloomberg Terminal
A FactSet subscription costs $12,000 per year for the entire product and represents the best-paid alternative to the Bloomberg terminal. However, this price is still high for individual traders and financial researchers.
FactSet is a robust and competent alternative to the Bloomberg Terminal, offering a rich suite of features targeted at finance professionals and institutions. While its price tag is still steep for individual investors or smaller firms, it costs significantly less than Bloomberg’s offering, offering substantial value for the features.
The FactSet interface is intuitive and well-structured, a plus for users who spend long hours interacting with the system. The platform’s user experience design is laudable, with clearly demarcated functions and visually appealing data representation methods.
FactSet excels in providing comprehensive data coverage. Its data feeds offer real-time financial information, market data, company fundamentals, and economic data. It’s especially commendable in the research department, where users can access various research reports and analytics tools.
FactSet’s portfolio analytics feature is another high point. This feature provides insightful data and risk measurements for managing investment portfolios, which becomes invaluable for users managing large or complex portfolios.
One of FactSet’s distinguishing features is its excellent client service. The platform offers dedicated support, with representatives assisting in data integration, conducting specialized training, and more. This is quite the advantage for users transitioning from other platforms or those just starting the financial data software.
Despite its many strong points, there are areas where FactSet could improve. For one, the platform lacks the extensive community of users that Bloomberg Terminal boasts. While this doesn’t affect the quality of the data or tools provided, it does limit networking opportunities and real-time discussion, which many Bloomberg users find invaluable.
Additionally, the number of third-party integrations could be increased to better the system’s overall flexibility. While FactSet allows for integration with Microsoft Office and some programming languages like Python, it’s somewhat behind the curve compared to its competitors.
In conclusion, FactSet is a formidable competitor in financial data software, especially for those looking for a more budget-friendly alternative to Bloomberg. It has much to offer: an intuitive interface, extensive data coverage, and excellent customer support. However, it must enhance its user community and integration capabilities to compete toe-to-toe with Bloomberg Terminal.

He is an expert in financial niche, long-term trading, and weekly technical levels.
The primary field of Igor's research is the application of machine learning in algorithmic trading.
Education: Computer Engineering and Ph.D. in machine learning.
Igor regularly publishes trading-related videos on the Fxigor Youtube channel.
To contact Igor write on:
igor@forex.in.rs
