Table of Contents
This article will show you that we can use the best overbought oversold Indicator for mt4 and have excellent profit. Instead, we will suggest a strategy that can help to help you avoid lousy over-trading.
What is overbought?
Overbought is a term used to describe a security trading at a price level significantly higher than its fair value. This typically reflects an expectation that the market will correct the security price shortly as investors begin to sell off their holdings in response to the high price. Ultimately, overbought conditions can lead to increased volatility and losses for investors who hold these securities.


What is oversold?
Oversold is a term that describes a security trading at a price level significantly lower than its fair value. Usually, when the price reaches the minimum value on the chart for some period, we say oversold. The term oversold describes a condition where an asset has traded lower in price and is likely to see a price rally shortly. This can be identified through various technical indicators, such as RSI or MACD, which measure market momentum and help identify when an asset may be oversold or overbought. However, being oversold does not necessarily guarantee that a price bounce will happen, and traders should always exercise caution when trading in this type of market environment.
Overbought vs. oversold
For example, the RSI price indicator (from 1 to 100) marks prices above 70 as an overbought price area and below 30 as an oversold price area.

Overbought and oversold indicators are two important tools forex traders use to identify potential entry and exit points in the market. These indicators are based on technical analysis. They analyze various information, such as price action, historical data, and volume, to determine whether a currency pair is currently overbought or oversold.
Generally, when a currency is considered overbought or oversold, it may be due for a correction or reversal shortly. Therefore, traders who use these indicators will often look for opportunities to buy low or sell high based on their analysis of the market conditions.
There are many different overbought and oversold indicators available to forex traders. Some of the most popular include the Relative Strength Index (RSI), Stochastic Oscillator, Bollinger Bands, Moving Average Convergence Divergence (MACD), and Commodity Channel Index (CCI).
Overall, mastering overbought and oversold indicators can be an essential part of your strategy if you are looking to trade forex profitably. With careful analysis and practice, you can effectively utilize these tools to help you navigate the ever-changing market conditions in the forex world.
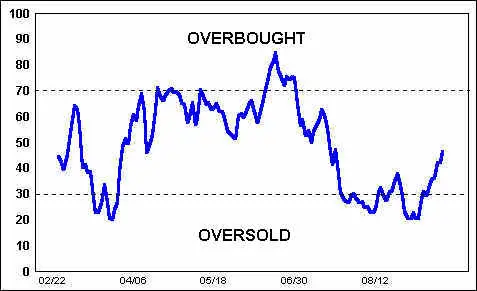
As we know, an oscillator is an object (in our case, a line on a chart) or data that moves back and forth between two points. We can use every primary oscillator, such as the Relative Strength Indicator RSI, MACD, or Stochastic Oscillator, to find overbought and oversold points on the chart. See the image below :
For the RSI indicator, the overbought area is above 70, and the oversold area is below 30. Most traders use this tool to find the overbought and oversold areas. But this is not a sign that you must buy from an oversold zone and sell from an overbought zone.
So we need to make a filter and only choose some trades.
Here is one indicator that we use and decide how to buy from the bottom and sell from the top :
Example strategy :
See :
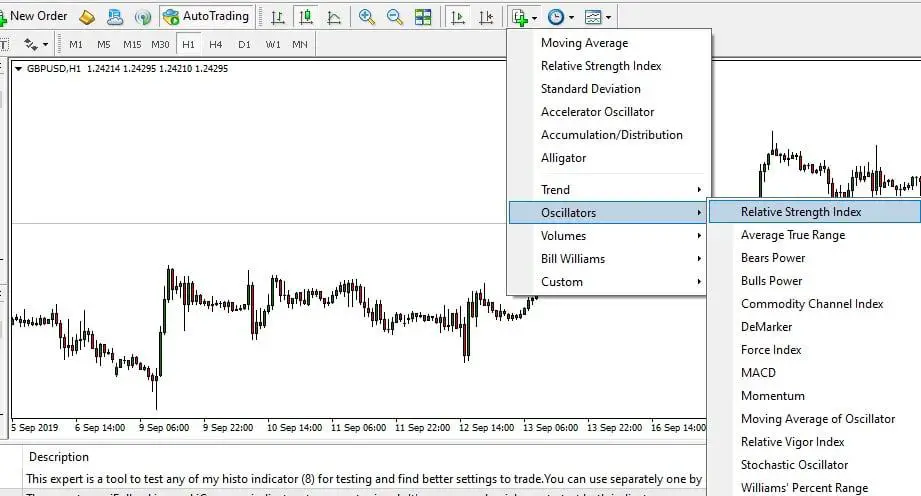
Download Overbought Oversold Indicator
Please download Overbought Oversold Indicator in MT4 :
Download OverBoughtOversold Indicator
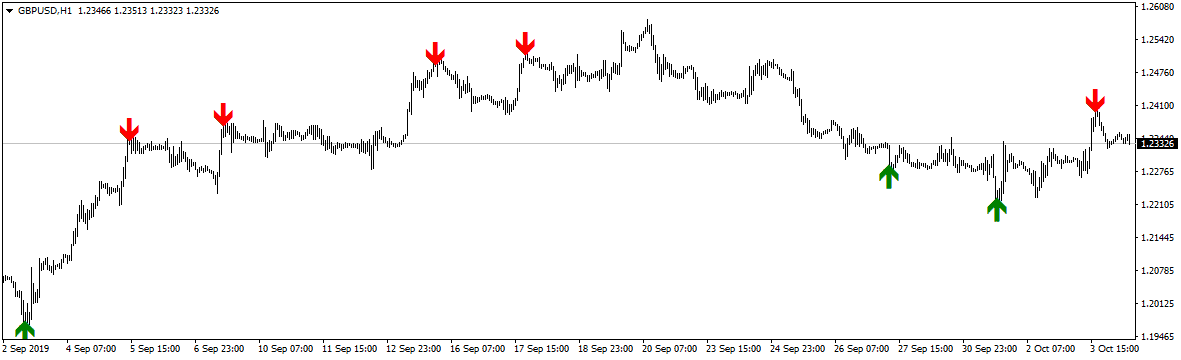
As shown in Figure, we do not trade every moment when the price goes into an overbought or oversold area. We have another trigger. It is an indicator that measures the current price and volume exhaustion.
BUY: If the price is in an oversold area AND an hourly close area, the Overbought Oversold indicator shows the BUY arrow.
SELL: If the price is overbought area AND an hourly close area, the Overbought Oversold indicator shows the SELL arrow.
Suggestion :
You can combine every oscillator indicator (RSI, MACD, Stochastic, etc.) and some indicator that can filter the number of trades. It can be some histogram.
Why is there no best Overbought Oversold Indicator?
When we have an oversold area on the H1 chart, that can be the beginning of the selling moment on the H4 and daily charts. As the same is true for the overbought zone.
See this recent example :
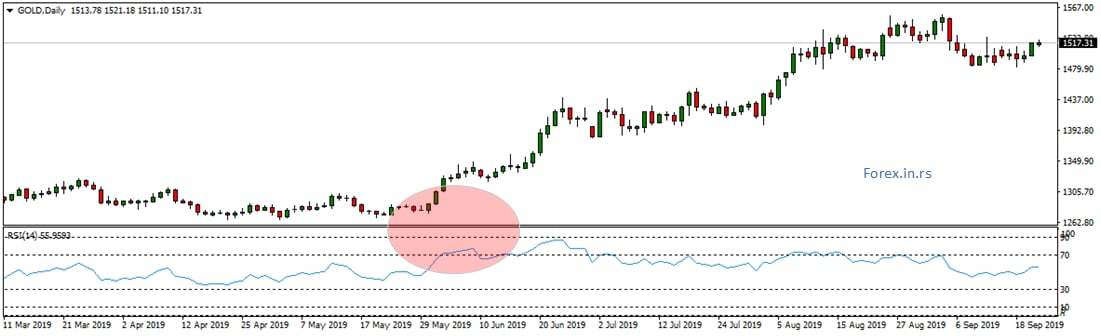
Gold reached the overbought area at the beginning of September at the price of 1328. After several weeks, the everyday price is higher and higher, reaching the 1550 level. Each instrument can be days, months, or years in overbought mode. There are no
The outcome of the trade significantly relates to the type of strategies used. When suitable systems are used consistently, traders familiarize themselves with the prerequisites for success. One of the prerequisites for a successful trade is in-depth knowledge of overbought and oversold stocks. When traders understand how overbought and oversold stocks affect a market, they can determine whether or not the next trade can be compelled without assistance and guidance. Assistance and guidance from brokers can be valuable tools when traders are beginning to learn. However, this tool may need to be updated as the trade continues.
Science research papers show many case studies that overbought and oversold zones do not have the same impact. Momentum strategies are appropriate for holding stocks in the long run in overbought zones, whereas contrarian strategies are proper for carrying stocks in the short run, staying in oversold zones.
As a result, an ever-updating market requires stock investors to update their programs constantly. If the stock investor does not update as frequently as the market, they risk losing their investment. Overbought and oversold stocks can potentially create a more significant gap in market value. Overbought and oversold stocks can determine the specific outcome of a situation. Therefore when a stock reaches more than 70 market points, it is given the title of overbought. When the stock drops below 70 market points, it is given the opposite label. The contrasting tile is created from an initial loss. The initial loss is determined by the preexisting average values on the market. The preexisting average values have been calculated based on currency rates for each country involved in the trade. Brokers and traders from each country are encouraged to work together to find a viable solution for each trading group.
Identifying Overbought and Oversold Stocks and Forex pairs in Theory
There are a few things to look for for the leading indicators for oversold and overbought stock or forex pair. Programs such as MT4 offer highly effective and robust trading on the most common methods for forex trading and a thorough definition of both methods. When analyzing these types, a range of tips can be applied. When looking for oversold and overbought stock or pair, the first tip is to indicate which type is negative and which is positive. Oversold stock refers specifically to stock that is most frequently sold on the trading market. Overbought stock can easily be spotted on the market using the right tools. Oversold stock can also be spotted on the market quickly. When the stock rises above 70% percent, it is considered overbought. When the stock decreases below 70%, it is considered oversold. These figures are subject to change when they are used. Once the figures change, they can accelerate at higher rates to accommodate market trends. This is only theory…
There are important ways to notice overbought and oversold stocks on the market. This strategy is essential when deciding if a particular stock is a wise investment. Viable trade entries rely upon this technique to ensure success. The RSI and the stochastic indicator are the two most common ways to notice and classify oversold stocks. The RSI allows stockholders to understand specific values contributing to the trade deal’s overall success. This is very important when dealing with actual trades, such as international deals. The stochastic indicator is a type of oscillator. RSI is commonly calculated based on loss and gain, while the stochastic indicator is most widely calculated based on ranges of prices over a more significant period.
Both of these unique market methods can be successfully applied to stocks on the market. These methods can be used together in specific scenarios. An experienced trader understands the best use for each type of method. As a result, each trader can use the method that will lead to a successful trade. When a stochastic reaches 100 points, the session is closed. When the session points get 100, the highest price is reached. The standard protocol is to complete the stock when each session’s highest price is achieved. When these unique techniques are used in tandem, the outcome is more likely to be positive. These tools should be used, along with other strategic market methods. When these tools are combined with others, they create trade entry market points. The tools can be used in addition to different proven strategies that work with the trading platform.
Conclusion
There is no statistical proof that buying from the bottom or selling from the top brings you profit. The market is always in some cycles. The H1 chart and H4 chart’s oversold area is maybe only the beginning of more selling pressure on the Daily and weekly chart, and maybe in the next whole month, we will see new lower lows.
But if you are a short-time trader with a defined stop loss, you can try to filter trades and buy from the bottom or sell from the top with a tight stop loss and use the additional indicator and additional trigger.

He is an expert in financial niche, long-term trading, and weekly technical levels.
The primary field of Igor's research is the application of machine learning in algorithmic trading.
Education: Computer Engineering and Ph.D. in machine learning.
Igor regularly publishes trading-related videos on the Fxigor Youtube channel.
To contact Igor write on:
igor@forex.in.rs
